Decimal HTO chart — free printable diagram
Free maths resource for teachers · CC BY-NC 4.0
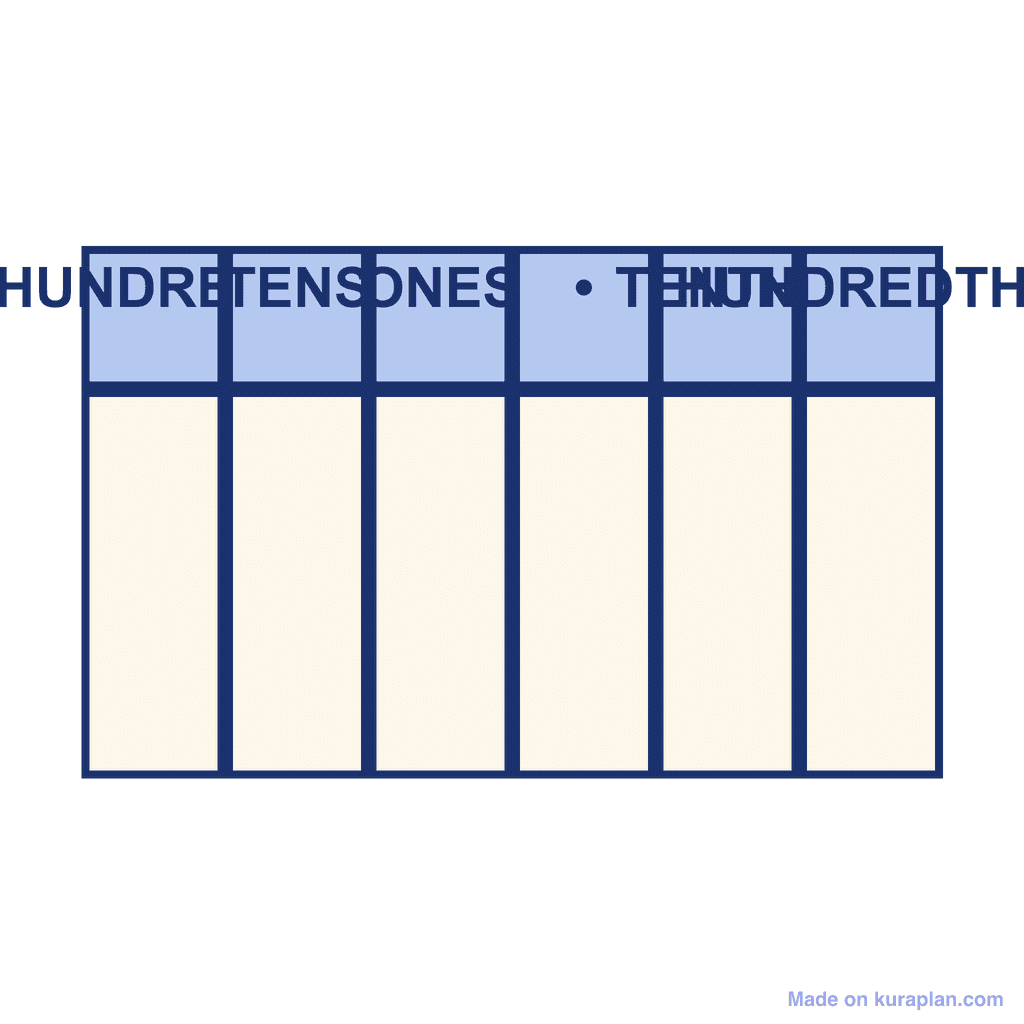
About this illustration
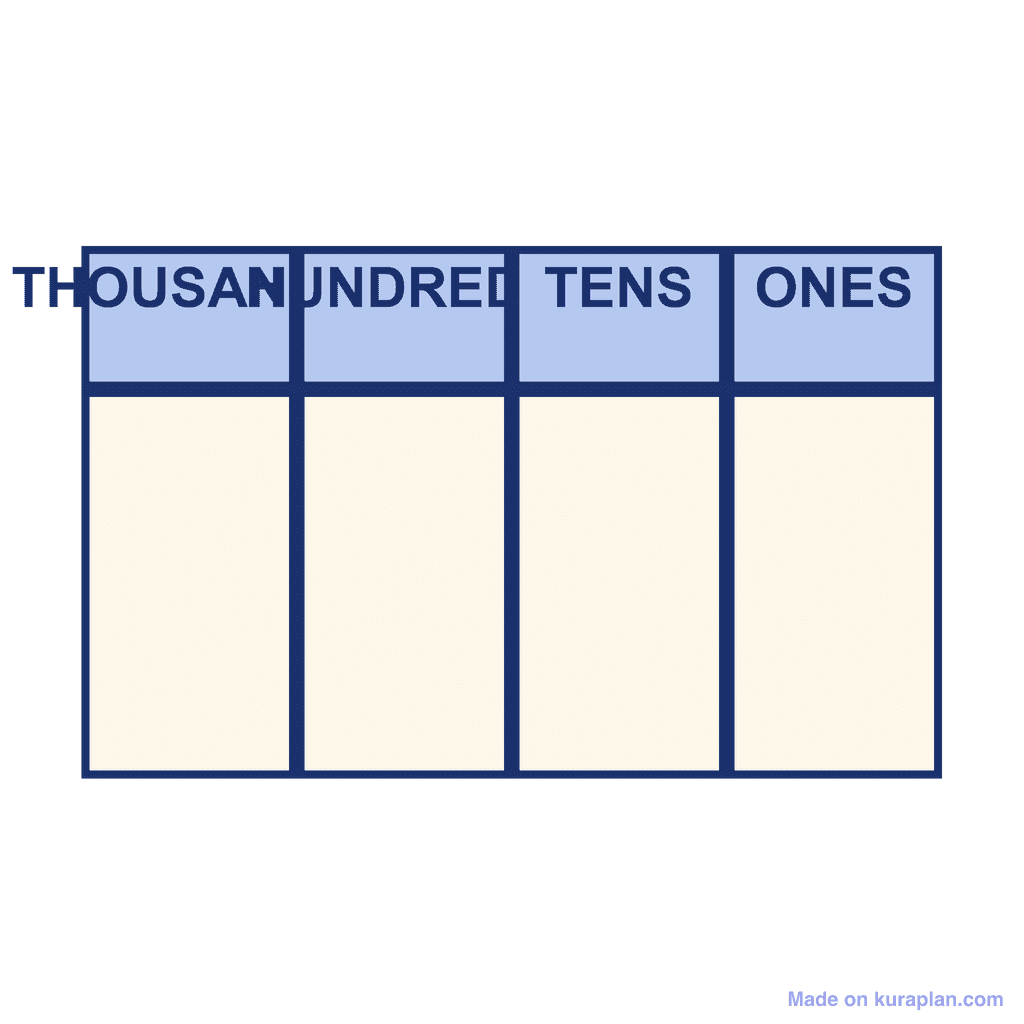
Place value chart template with columns: Hundreds, Tens, Ones, •, Tenths, Hundredths. For teaching place value, partitioning numbers.
How to read a hundreds to hundredths place-value chart
This is a blank place-value chart with 5 columns: Hundreds · Tens · Ones · Tenths · Hundredths, with the decimal point between the ones and the tenths. One digit goes in each column, and each column is worth ten times the column to its right, so the position of a digit is what decides its value.
- Columns
- 5
- Column headings
- Hundreds · Tens · Ones · Tenths · Hundredths
- Largest column
- Hundreds — one counter there is worth 100
- Smallest column
- Hundredths — one counter there is worth 0.01
- Biggest number it holds
- 999.99
- Each column compared with its neighbour
- Ten times the column to its right
- The decimal point
- Sits between the Ones and the Tenths and never moves
- A place-value chart is read right to left, and each column is worth ten times the one to its right: hundreds = 100, tens = 10, ones = 1, tenths = 0.1, hundredths = 0.01. The digit tells you how many; the column tells you how much each one is worth.
- Writing a number into the chart means putting one digit in each column. For 342.75 that is 3 in the hundreds, 4 in the tens, 2 in the ones, 7 in the tenths and 5 in the hundredths — so the 7 is worth 0.7, not 7.
- The zero is the column that teaches the chart. A zero in a column means there is nothing of that size, but it still has to be written, because it is what holds the other digits in their places.
- Moving right past the decimal point keeps the same rule going: tenths are ten times smaller than ones, and hundredths are ten times smaller again. The smallest step this chart can show is 0.01.
How to use
- 1Right-click the image and choose “Save image as”, or use the download button.
- 2Use it in your classroom worksheets, slides or printables — free under CC BY-NC 4.0.
- 3Attribute as “Image by Kuraplan” or link back to kuraplan.com. Not for commercial resale.
Turn this image into a worksheet
This illustration is already in Kuraplan's editor — describe the worksheet you need and the AI builds it around the image in seconds.
Related illustrations
More free maths illustrations
Free worksheets on Decimal HTO chart
All free worksheetsBrowse by subject
21 subjects · 3,773 free illustrations
Cross-Curricular
835 free illustrations
Science
814 free illustrations
English
612 free illustrations
Geography
549 free illustrations
Health
200 free illustrations
Social Studies
177 free illustrations
Religious Education
139 free illustrations
Music
128 free illustrations
Art
66 free illustrations
Drama
56 free illustrations
Social Sciences
48 free illustrations
History
47 free illustrations
Arts
26 free illustrations
PE
25 free illustrations
Te Reo Māori
24 free illustrations
Technology
16 free illustrations
Culture
7 free illustrations
Business
1 free illustrations
English
1 free illustrations
English (ELA)
1 free illustrations
Languages
1 free illustrations