ScienceFreePrintable

Light Intensity and Photosynthesis

A free science worksheet ready for your classroom. Open in Kuraplan to grab the print-ready PDF, customize it for your students, or generate a fresh version in seconds.
Light Intensity and Photosynthesis worksheet preview
Name:Date:

Light Intensity and Photosynthesis

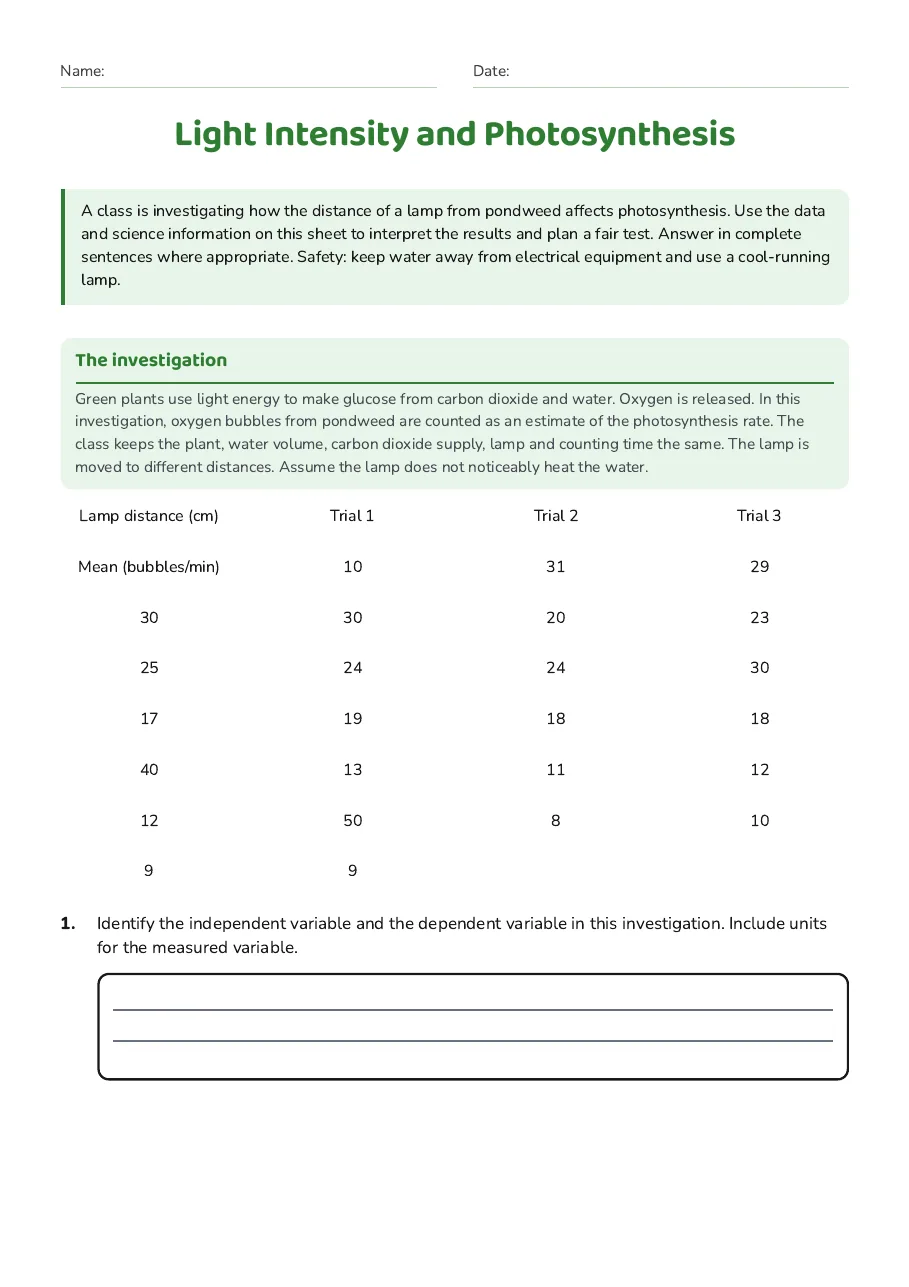
A class is investigating how the distance of a lamp from pondweed affects photosynthesis. Use the data and science information on this sheet to interpret the results and plan a fair test. Answer in complete sentences where appropriate. Safety: keep water away from electrical equipment and use a cool-running lamp.

The investigation

Green plants use light energy to make glucose from carbon dioxide and water. Oxygen is released. In this investigation, oxygen bubbles from pondweed are counted as an estimate of the photosynthesis rate. The class keeps the plant, water volume, carbon dioxide supply, lamp and counting time the same. The lamp is moved to different distances. Assume the lamp does not noticeably heat the water.

Lamp distance (cm)

Trial 1

Trial 2

Trial 3

Mean (bubbles/min)

10

31

29

30

30

20

23

25

24

24

30

17

19

18

18

40

13

11

12

12

50

8

10

9

9

1.Identify the independent variable and the dependent variable in this investigation. Include units for the measured variable.
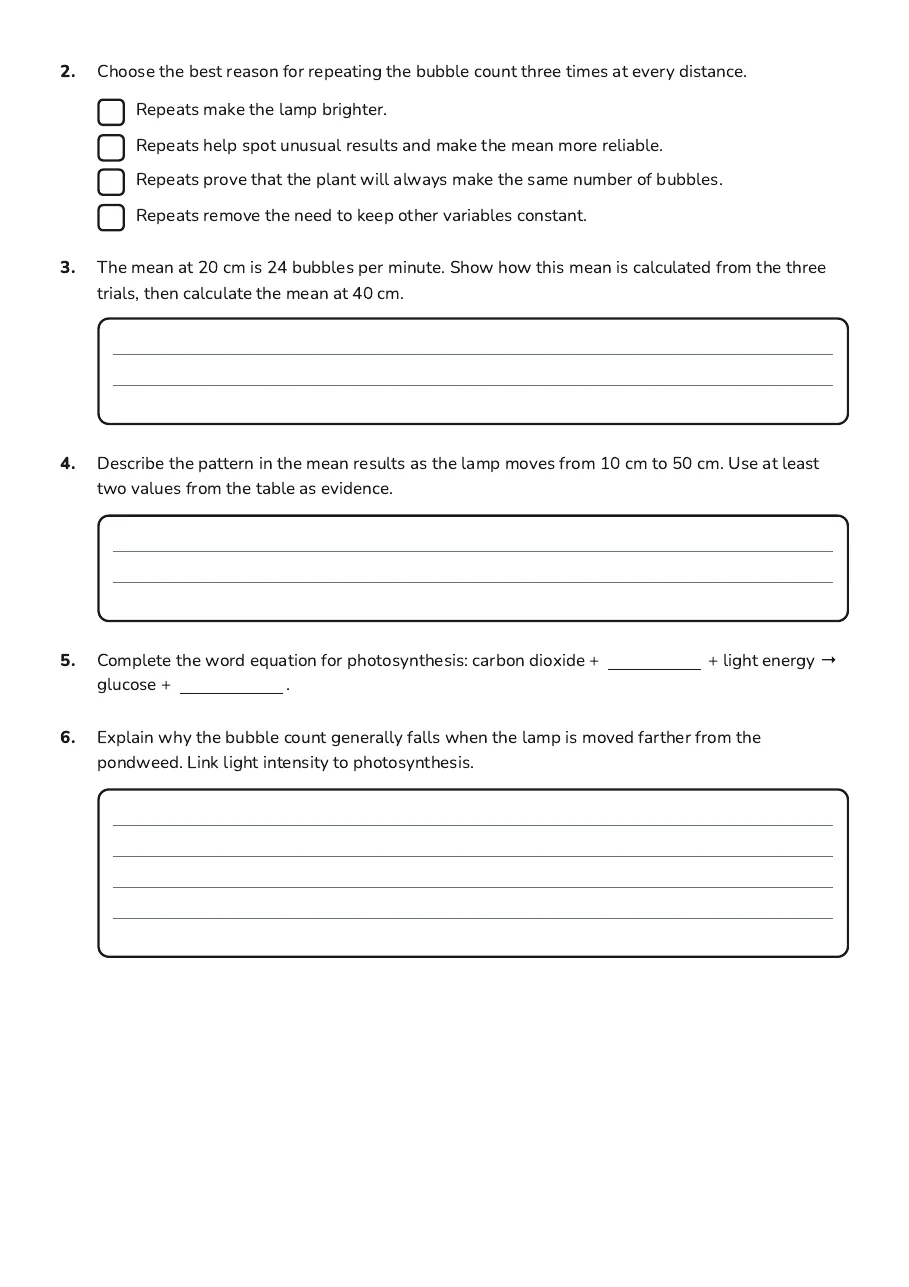
2.Choose the best reason for repeating the bubble count three times at every distance.
  • Repeats make the lamp brighter.
  • Repeats help spot unusual results and make the mean more reliable.
  • Repeats prove that the plant will always make the same number of bubbles.
  • Repeats remove the need to keep other variables constant.
3.The mean at 20 cm is 24 bubbles per minute. Show how this mean is calculated from the three trials, then calculate the mean at 40 cm.
4.Describe the pattern in the mean results as the lamp moves from 10 cm to 50 cm. Use at least two values from the table as evidence.
5.Complete the word equation for photosynthesis: carbon dioxide + + light energy → glucose + .
6.Explain why the bubble count generally falls when the lamp is moved farther from the pondweed. Link light intensity to photosynthesis.
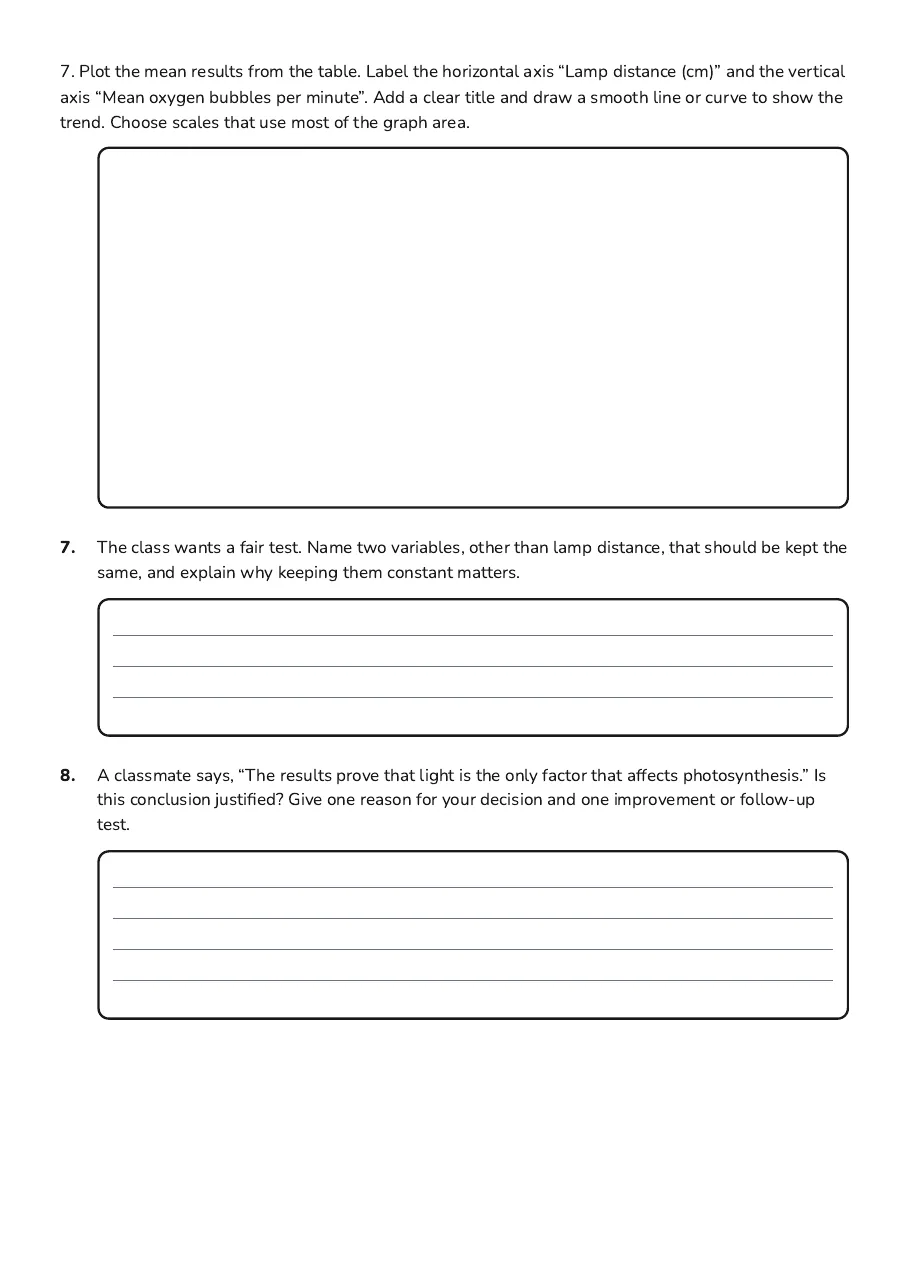
7. Plot the mean results from the table. Label the horizontal axis “Lamp distance (cm)” and the vertical axis “Mean oxygen bubbles per minute”. Add a clear title and draw a smooth line or curve to show the trend. Choose scales that use most of the graph area.
7.The class wants a fair test. Name two variables, other than lamp distance, that should be kept the same, and explain why keeping them constant matters.
8.A classmate says, “The results prove that light is the only factor that affects photosynthesis.” Is this conclusion justified? Give one reason for your decision and one improvement or follow-up test.

3 printable pages

  • Light Intensity and Photosynthesis, page 1 of 3: The investigation

    Page 1

  • Light Intensity and Photosynthesis, page 2 of 3: 2. Choose the best reason for repeating the bubble count three times at every distance.

    Page 2

  • Light Intensity and Photosynthesis, page 3 of 3: 7. Plot the mean results from the table. Label the horizontal axis “Lamp distance (cm)”…

    Page 3

About This Worksheet

Free in Kuraplan

Sign up free, grab the PDF, and customize it for your class.

Print-Ready

Formatted for standard paper. Clean layout, easy to read.

AI-Generated

Created with Kuraplan's AI, designed for real classroom use.

For Teachers & Parents

Use in classrooms, for homework, tutoring, or homeschool.

Need a custom version of this worksheet?

Kuraplan's AI generates custom worksheets in seconds — differentiated for every learner, aligned to your curriculum.

Generate Custom Worksheets — Free
No credit card Curriculum-aligned Under 60 seconds