ScienceFreePrintable
Biology Graph Detective Challenge
A free science worksheet ready for your classroom. Open in Kuraplan to grab the print-ready PDF, customize it for your students, or generate a fresh version in seconds.
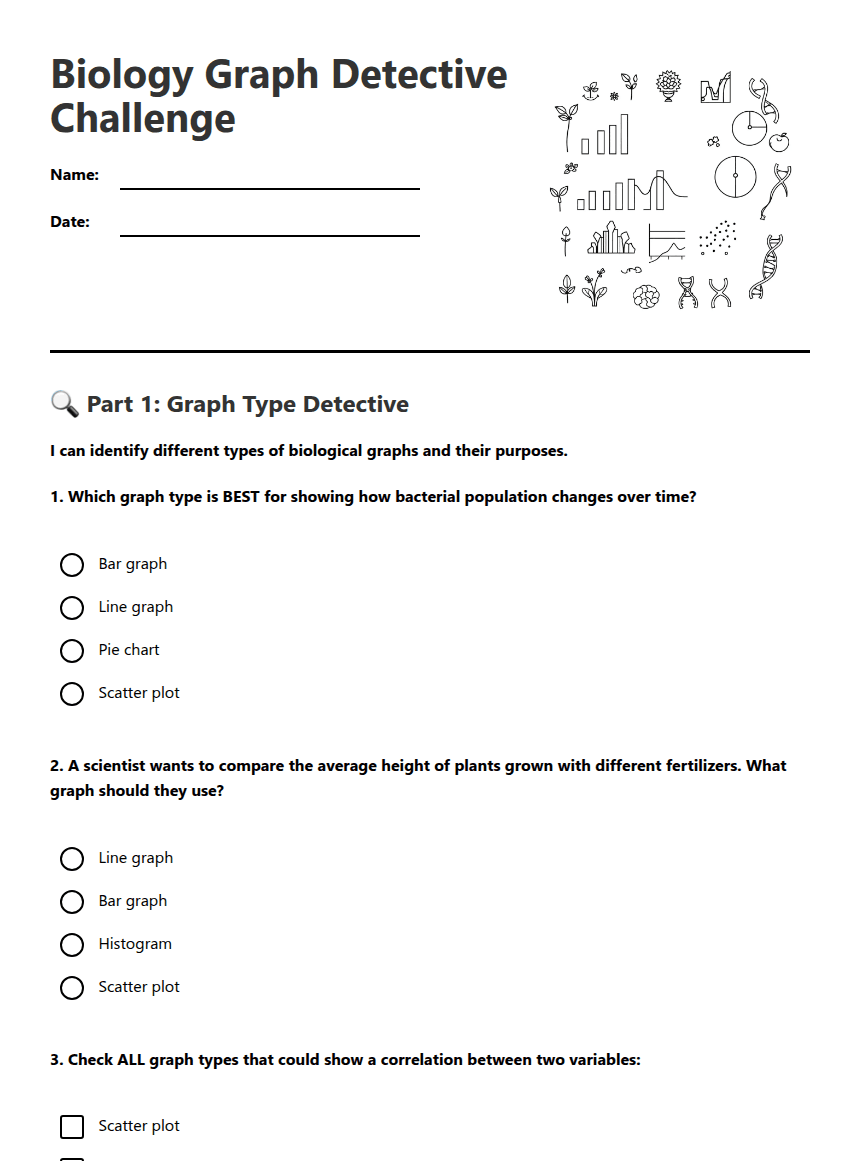
Biology Graph Detective Challenge
🔍 Part 1: Graph Type Detective
I can identify different types of biological graphs and their purposes.
1. Which graph type is BEST for showing how bacterial population changes over time?
Bar graph
Line graph
Pie chart
Scatter plot
2. A scientist wants to compare the average height of plants grown with different fertilizers. What graph should they use?
Line graph
Bar graph
Histogram
Scatter plot
3. Check ALL graph types that could show a correlation between two variables:
Scatter plot
Line graph
Pie chart
Bar graph
4. What type of graph would best show what percentage of a forest ecosystem is made up of different tree species?
Line graph
Scatter plot
Pie chart
Histogram
📊 Part 2: Data Trend Analysis
I can interpret data trends and analyze correlations in biological graphs.
5. A graph shows enzyme activity (y-axis) vs. temperature (x-axis). The line goes up from 32°F to 98°F, then drops sharply after 98°F. What can you conclude?
6. In a scatter plot showing plant height vs. amount of sunlight, the points form an upward trend from left to right. This shows a _____________ correlation.
positive
negative
no
7. A line graph shows that as predator population increases, prey population decreases. Explain why this biological relationship makes sense:
🎯 Part 3: Graph Matching Challenge
I can match appropriate graph types to specific biological scenarios.
Biological Scenario
A. Comparing average blood pressure in different age groups
B. Showing how heart rate changes during exercise over 30 minutes
C. Displaying the proportion of different blood types in a population
D. Investigating if there's a relationship between study time and test scores
Best Graph Type
1. Scatter plot
2. Bar graph
3. Line graph
4. Pie chart
8. Extension Activity (Honors): Design your own biological experiment and explain what type of graph you would use to display your results. Include your hypothesis and variables.
9. Differentiation Support: Circle the key words that help you choose the right graph type: "changes over TIME" → _______ graph, "COMPARING categories" → _______ graph, "parts of a WHOLE" → _______ chart
About This Worksheet
Free in Kuraplan
Sign up free, grab the PDF, and customize it for your class.
Print-Ready
Formatted for standard paper. Clean layout, easy to read.
AI-Generated
Created with Kuraplan's AI, designed for real classroom use.
For Teachers & Parents
Use in classrooms, for homework, tutoring, or homeschool.
Need a custom version of this worksheet?
Kuraplan's AI generates custom worksheets in seconds — differentiated for every learner, aligned to your curriculum.
Generate Custom Worksheets — Free No credit card Curriculum-aligned Under 60 seconds
More Science Worksheets
9th Grade
Cell Structure and Function
Free
10th Grade
Photosynthesis Investigation Worksheet
Free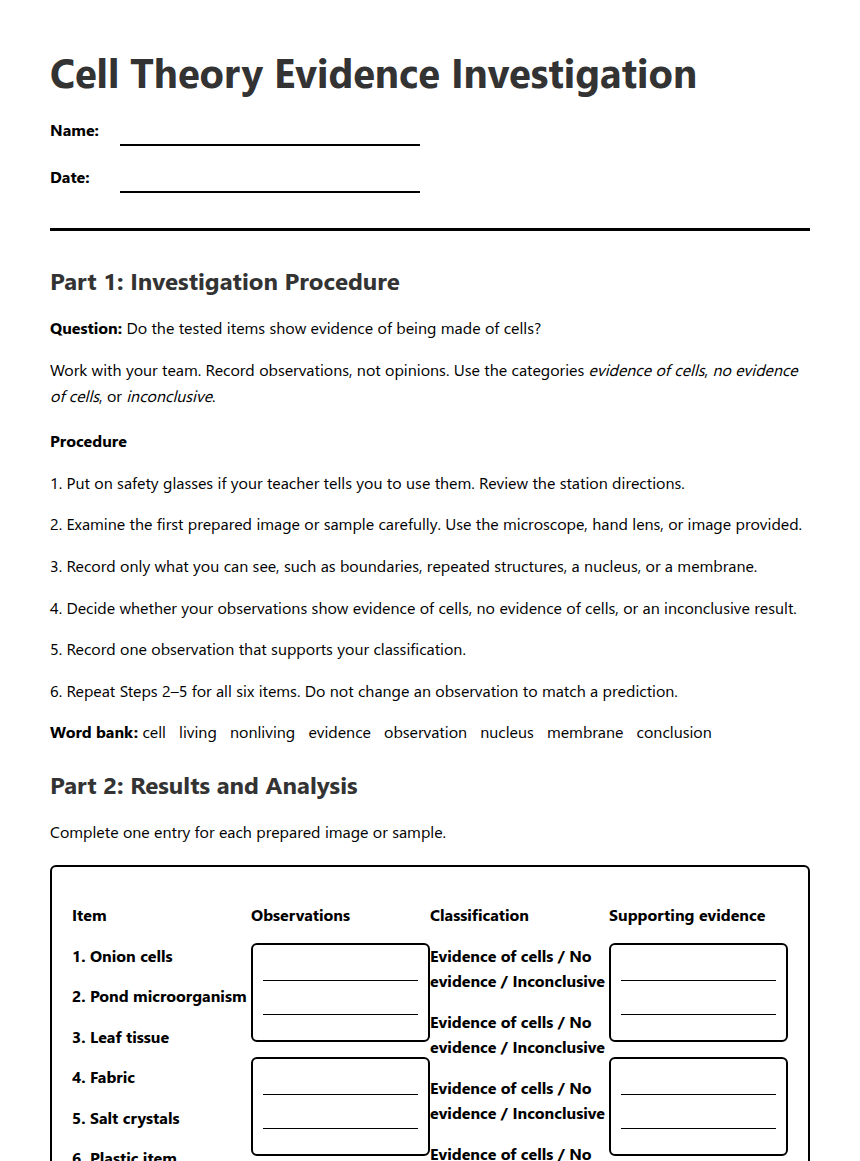
7th Grade
Cell Theory Evidence Investigation
Free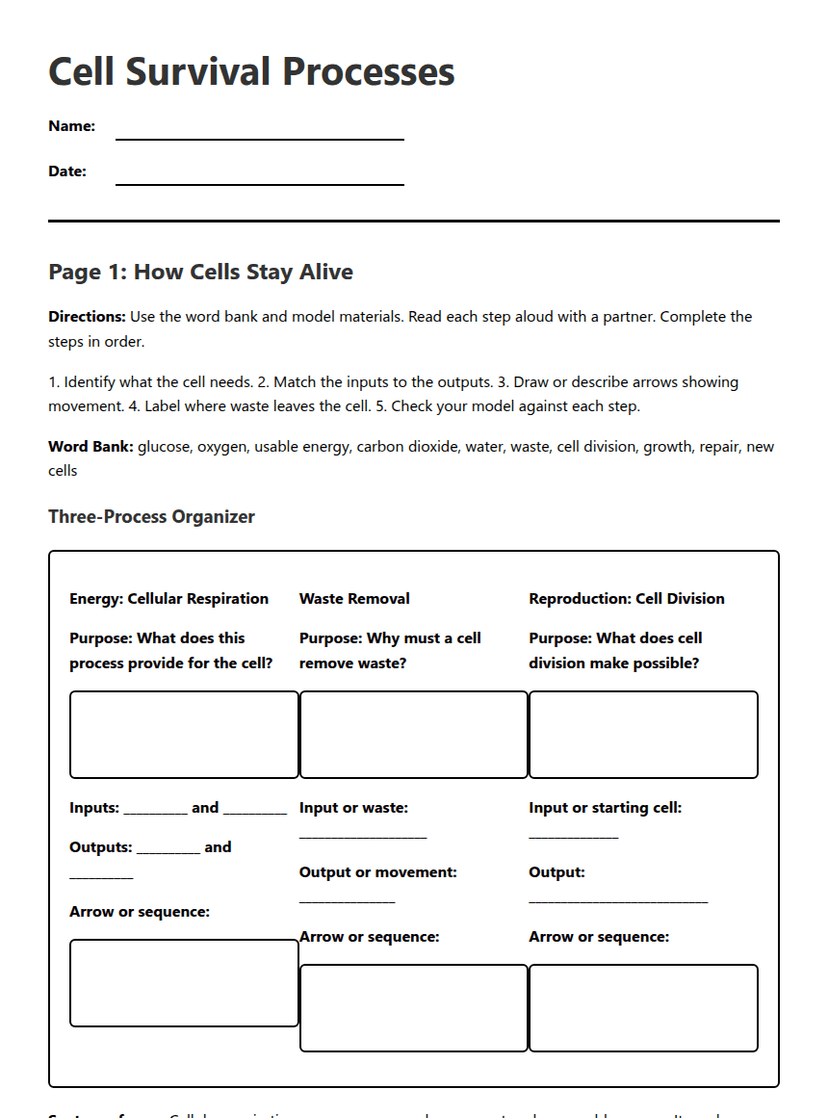
7th Grade
Cell Survival Processes
Free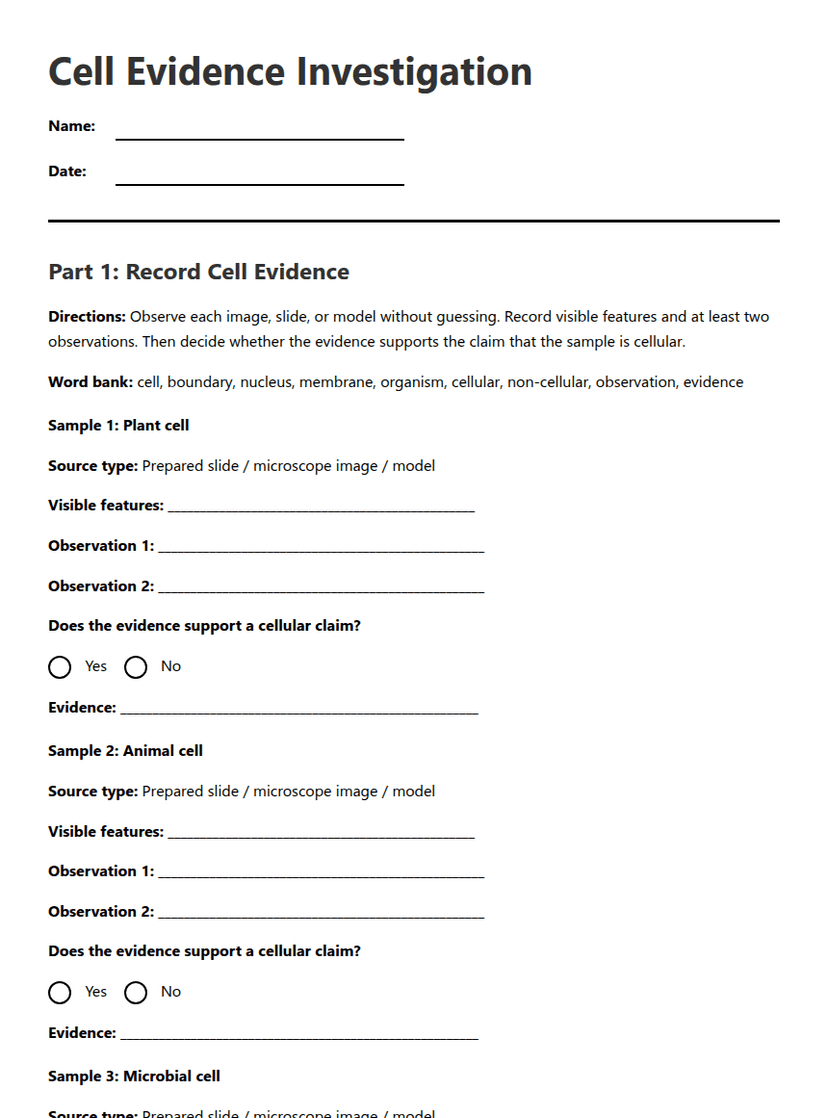
7th Grade
Cell Evidence Investigation
Free
7th Grade
Cell Theory Evidence Map
Free
7th Grade
Living or Nonliving?
Free
10th Grade