MathsFreePrintable
Real-World Statistics Applications
A free maths worksheet ready for your classroom. Open in Kuraplan to grab the print-ready PDF, customize it for your students, or generate a fresh version in seconds.
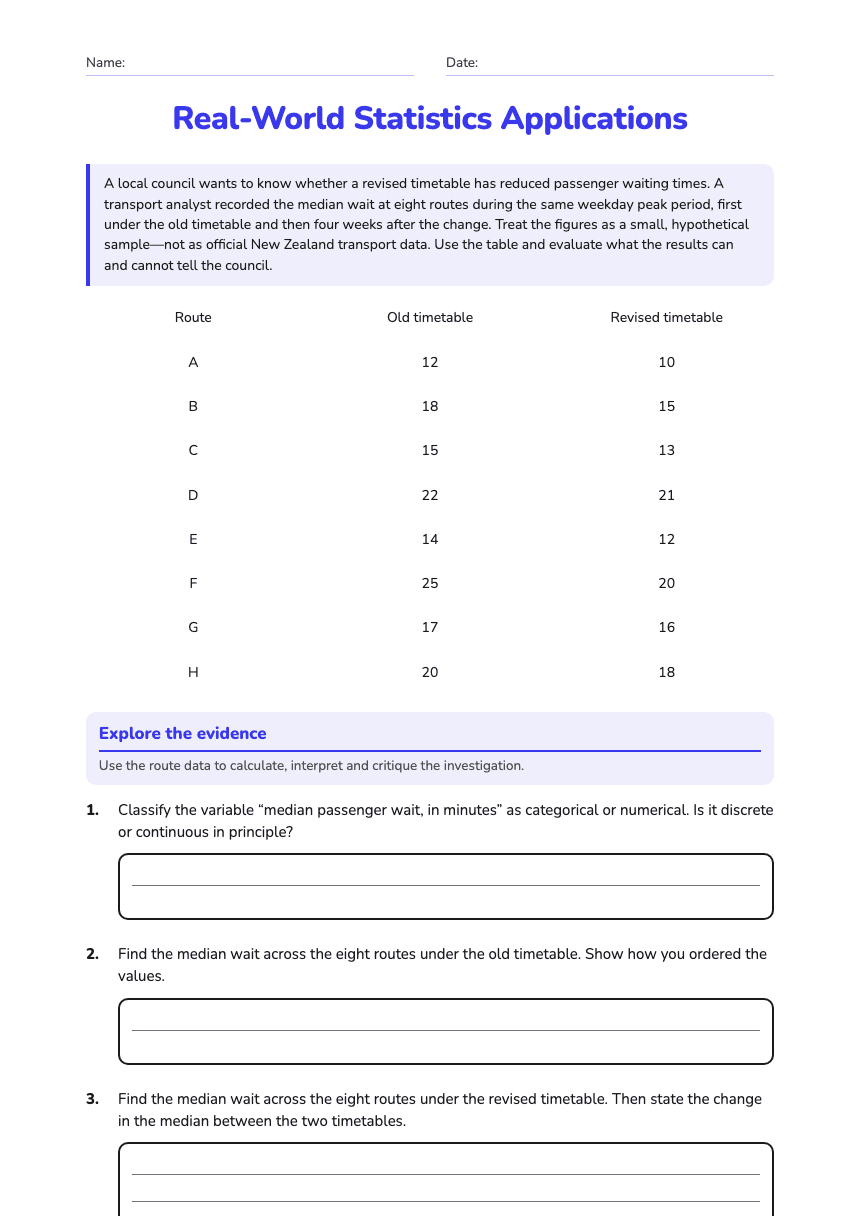
Name:Date:
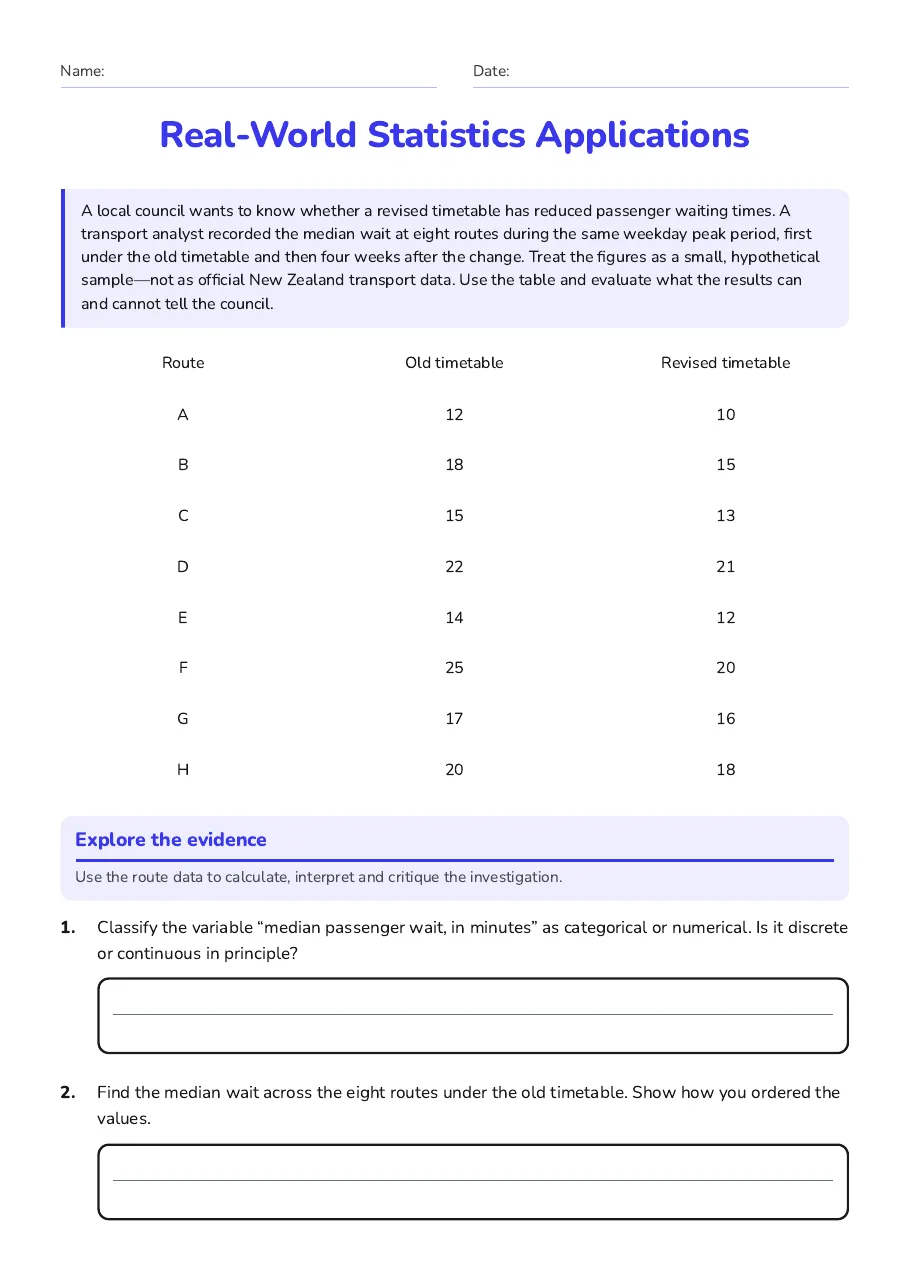
Real-World Statistics Applications
A local council wants to know whether a revised timetable has reduced passenger waiting times. A transport analyst recorded the median wait at eight routes during the same weekday peak period, first under the old timetable and then four weeks after the change. Treat the figures as a small, hypothetical sample—not as official New Zealand transport data. Use the table and evaluate what the results can and cannot tell the council.
Route
Old timetable
Revised timetable
A
12
10
B
18
15
C
15
13
D
22
21
E
14
12
F
25
20
G
17
16
H
20
18
Explore the evidence
Use the route data to calculate, interpret and critique the investigation.
1.Classify the variable “median passenger wait, in minutes” as categorical or numerical. Is it discrete or continuous in principle?
2.Find the median wait across the eight routes under the old timetable. Show how you ordered the values.
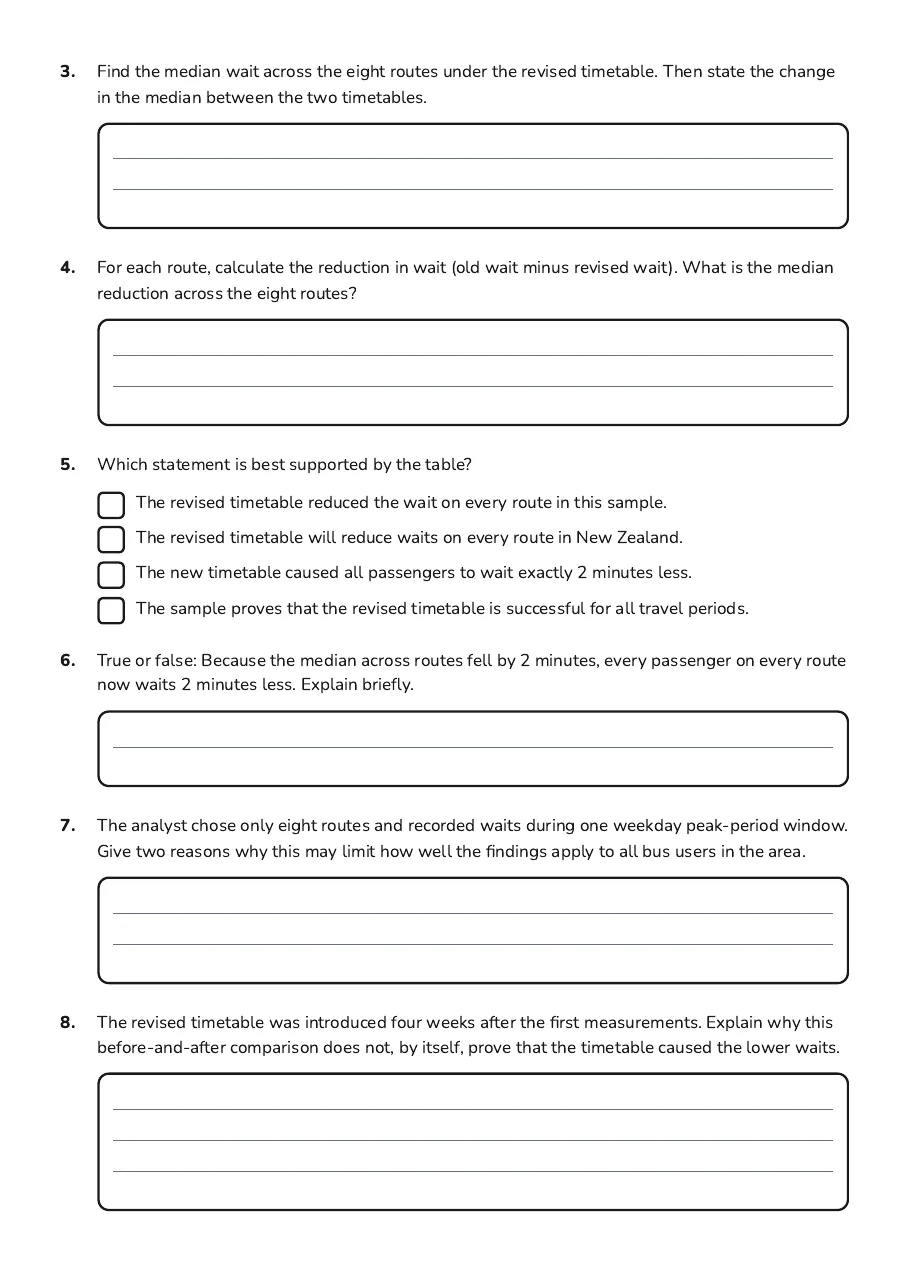
3.Find the median wait across the eight routes under the revised timetable. Then state the change in the median between the two timetables.
4.For each route, calculate the reduction in wait (old wait minus revised wait). What is the median reduction across the eight routes?
5.Which statement is best supported by the table?
- The revised timetable reduced the wait on every route in this sample.
- The revised timetable will reduce waits on every route in New Zealand.
- The new timetable caused all passengers to wait exactly 2 minutes less.
- The sample proves that the revised timetable is successful for all travel periods.
6.True or false: Because the median across routes fell by 2 minutes, every passenger on every route now waits 2 minutes less. Explain briefly.
7.The analyst chose only eight routes and recorded waits during one weekday peak-period window. Give two reasons why this may limit how well the findings apply to all bus users in the area.
8.The revised timetable was introduced four weeks after the first measurements. Explain why this before-and-after comparison does not, by itself, prove that the timetable caused the lower waits.
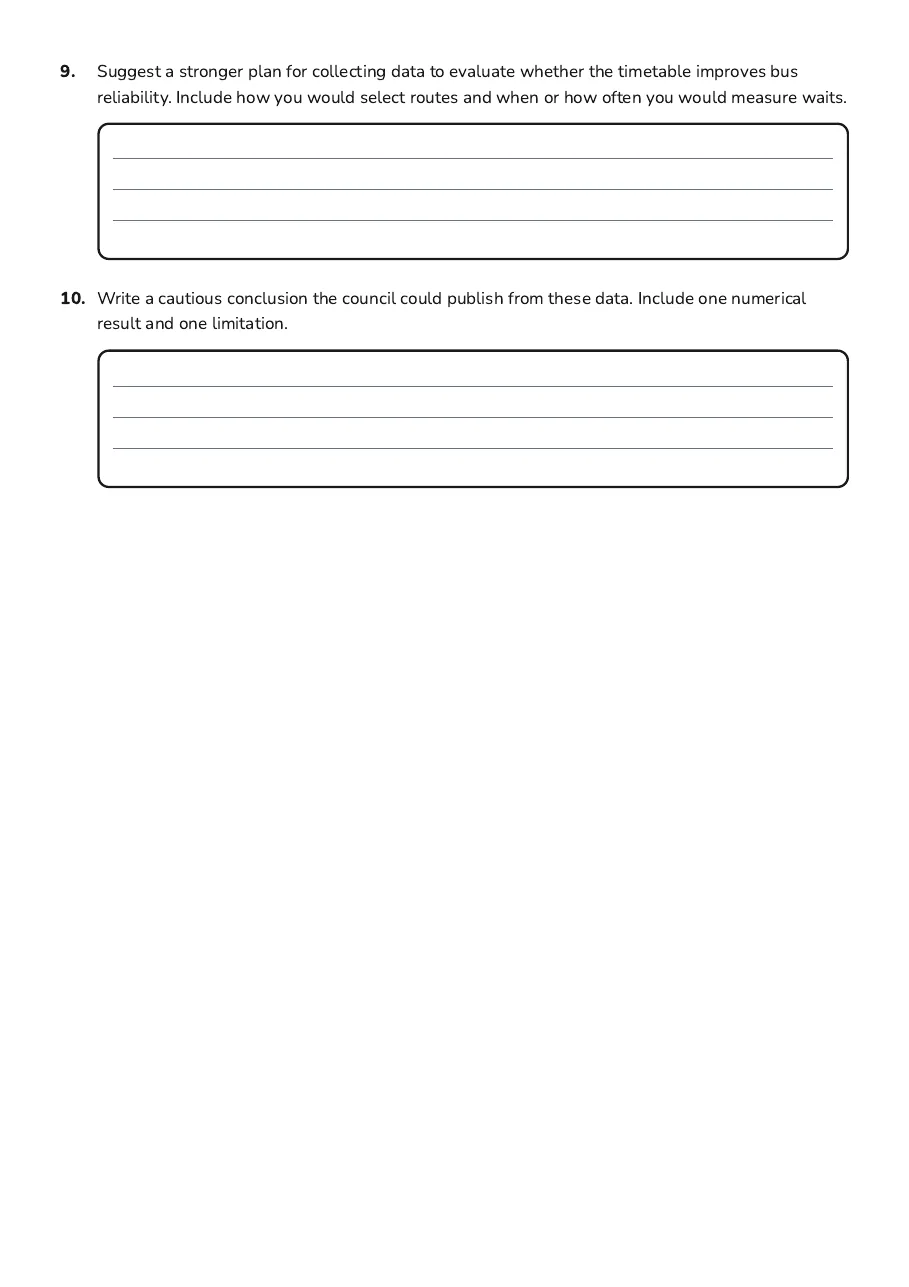
9.Suggest a stronger plan for collecting data to evaluate whether the timetable improves bus reliability. Include how you would select routes and when or how often you would measure waits.
10.Write a cautious conclusion the council could publish from these data. Include one numerical result and one limitation.
3 printable pages
Page 1
Page 2
Page 3
About This Worksheet
Free in Kuraplan
Sign up free, grab the PDF, and customize it for your class.
Print-Ready
Formatted for standard paper. Clean layout, easy to read.
AI-Generated
Created with Kuraplan's AI, designed for real classroom use.
For Teachers & Parents
Use in classrooms, for homework, tutoring, or homeschool.
Need a custom version of this worksheet?
Kuraplan's AI generates custom worksheets in seconds — differentiated for every learner, aligned to your curriculum.
Generate Custom Worksheets — Free No credit card Curriculum-aligned Under 60 seconds