MathematicsFreePrintable
Scatter Plot Data Questions
A free mathematics worksheet ready for your classroom. Open in Kuraplan to grab the print-ready PDF, customize it for your students, or generate a fresh version in seconds.
Name:Date:
Scatter Plot Data Questions
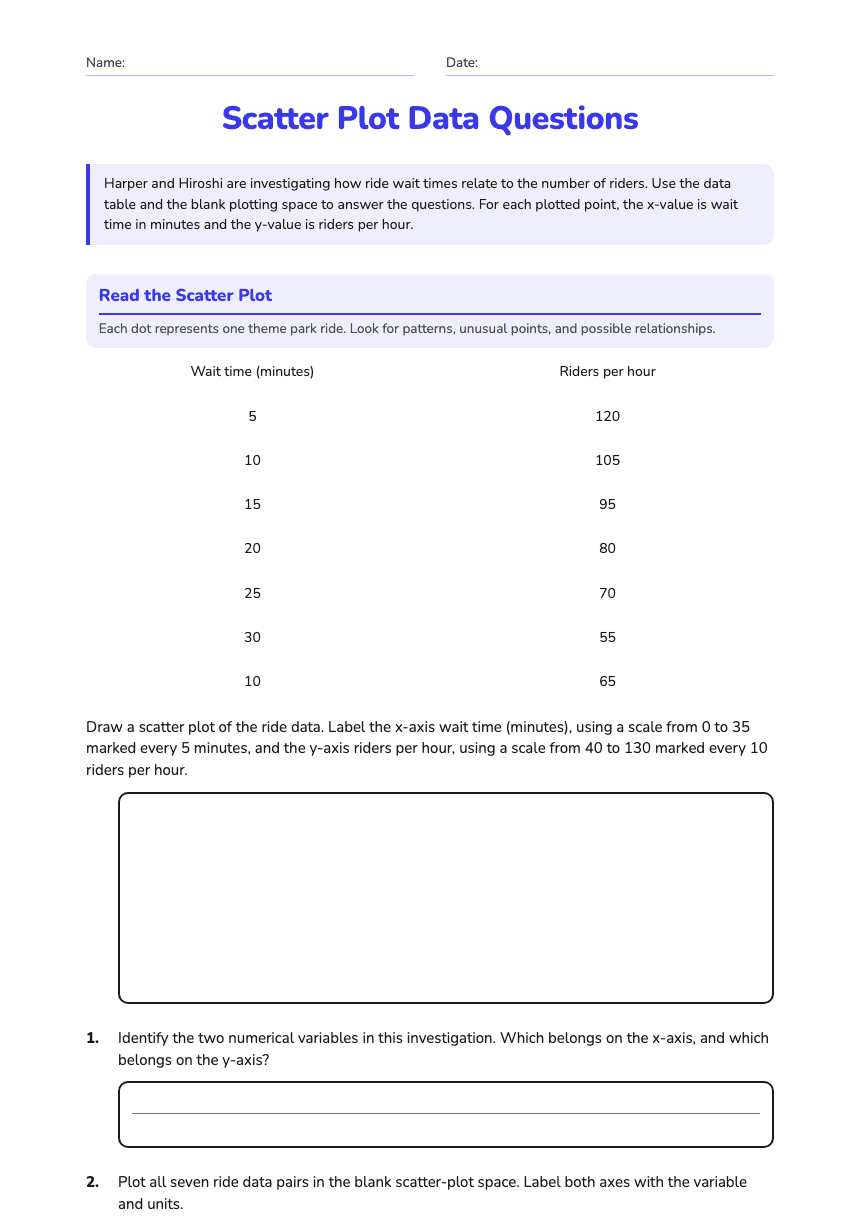
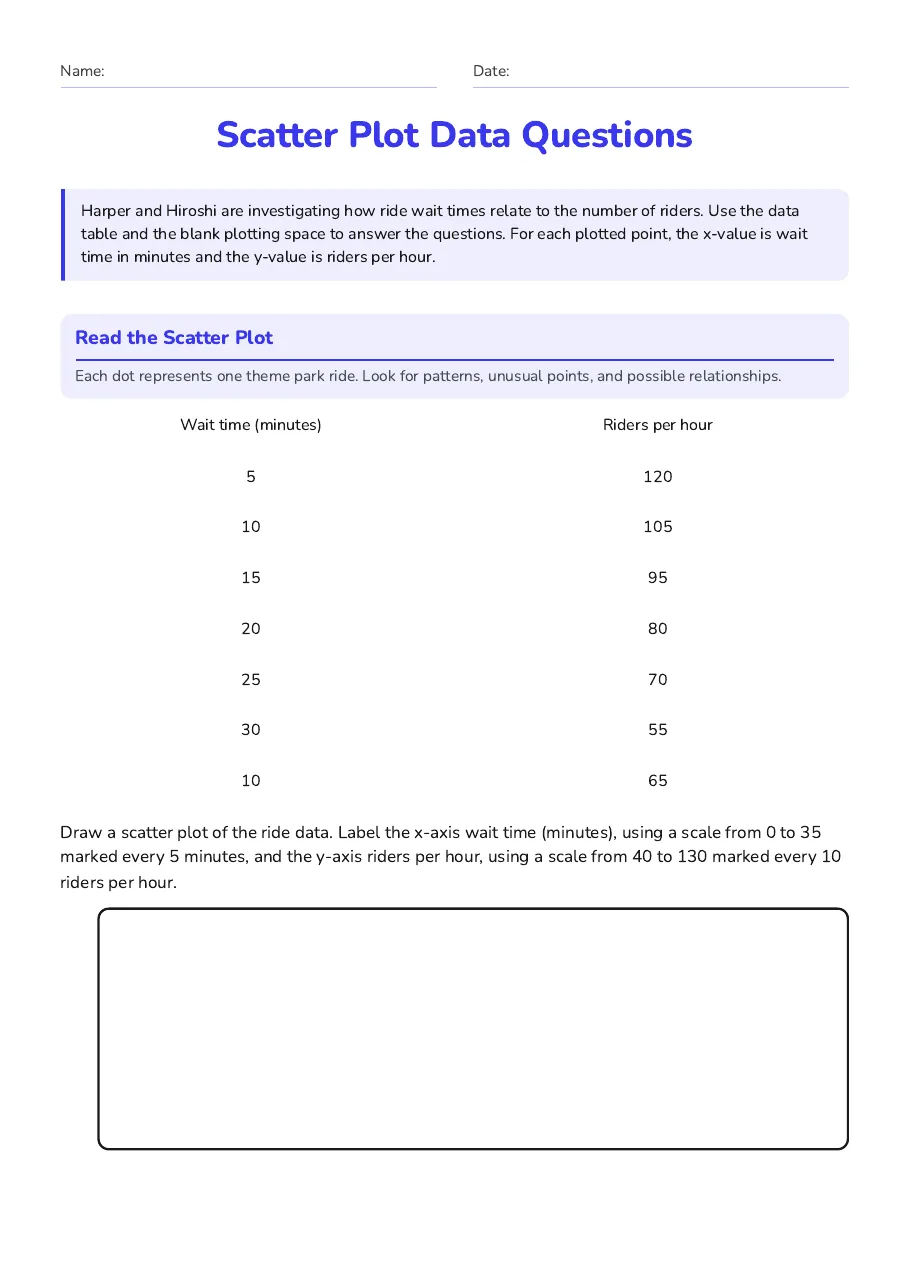
Harper and Hiroshi are investigating how ride wait times relate to the number of riders. Use the data table and the blank plotting space to answer the questions. For each plotted point, the x-value is wait time in minutes and the y-value is riders per hour.
Read the Scatter Plot
Each dot represents one theme park ride. Look for patterns, unusual points, and possible relationships.
Wait time (minutes)
Riders per hour
5
120
10
105
15
95
20
80
25
70
30
55
10
65
Draw a scatter plot of the ride data. Label the x-axis wait time (minutes), using a scale from 0 to 35 marked every 5 minutes, and the y-axis riders per hour, using a scale from 40 to 130 marked every 10 riders per hour.
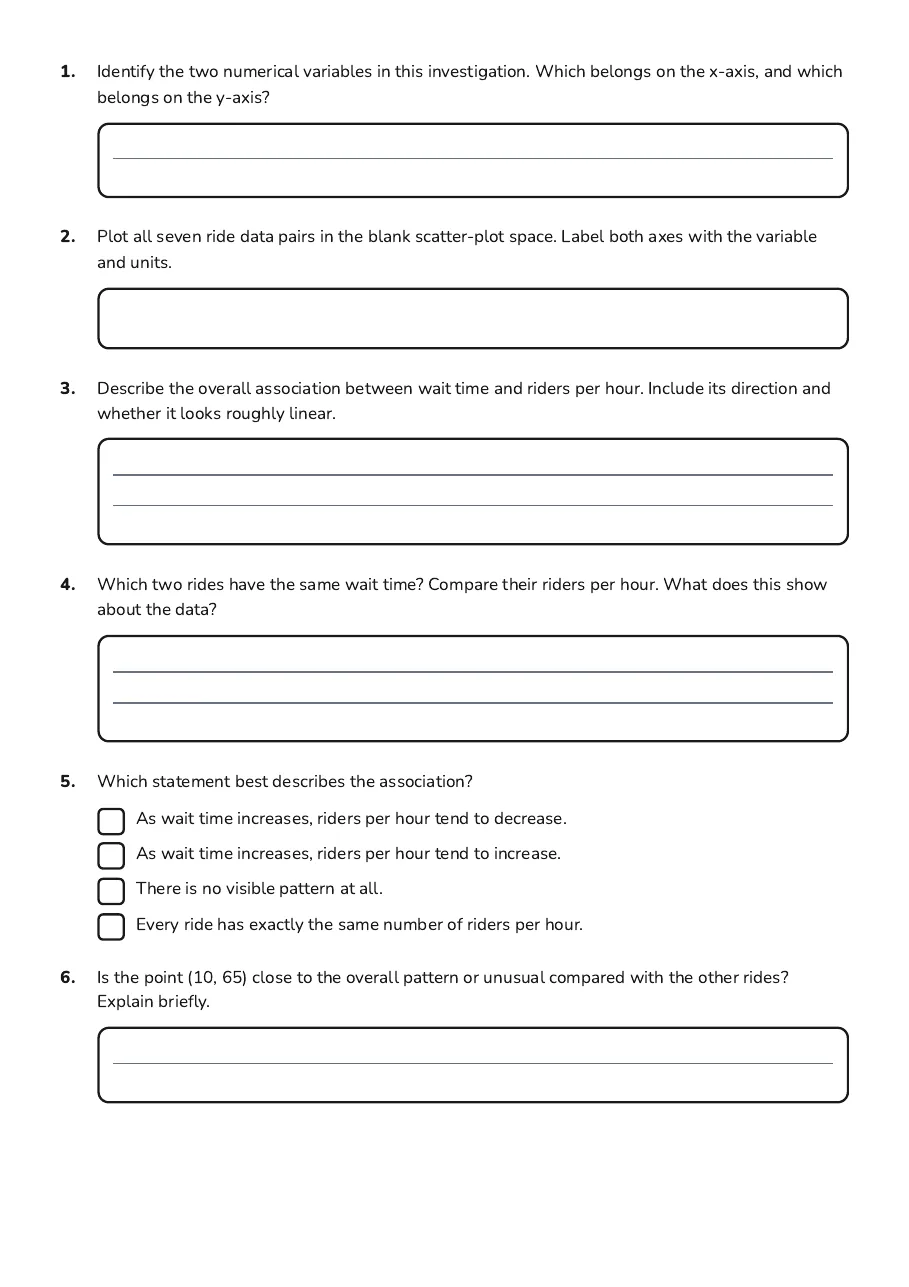
1.Identify the two numerical variables in this investigation. Which belongs on the x-axis, and which belongs on the y-axis?
2.Plot all seven ride data pairs in the blank scatter-plot space. Label both axes with the variable and units.
3.Describe the overall association between wait time and riders per hour. Include its direction and whether it looks roughly linear.
4.Which two rides have the same wait time? Compare their riders per hour. What does this show about the data?
5.Which statement best describes the association?
- As wait time increases, riders per hour tend to decrease.
- As wait time increases, riders per hour tend to increase.
- There is no visible pattern at all.
- Every ride has exactly the same number of riders per hour.
6.Is the point (10, 65) close to the overall pattern or unusual compared with the other rides? Explain briefly.
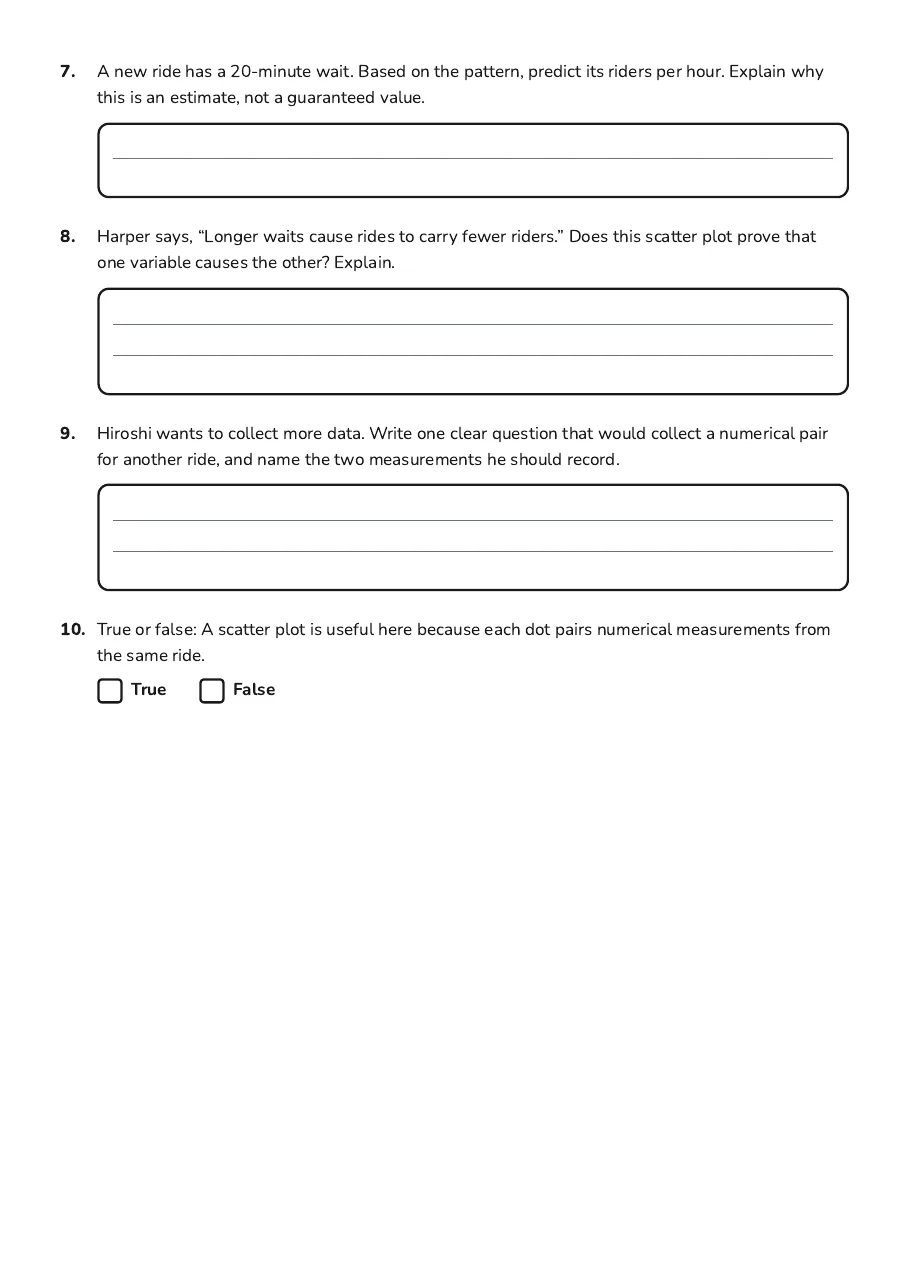
7.A new ride has a 20-minute wait. Based on the pattern, predict its riders per hour. Explain why this is an estimate, not a guaranteed value.
8.Harper says, “Longer waits cause rides to carry fewer riders.” Does this scatter plot prove that one variable causes the other? Explain.
9.Hiroshi wants to collect more data. Write one clear question that would collect a numerical pair for another ride, and name the two measurements he should record.
10.True or false: A scatter plot is useful here because each dot pairs numerical measurements from the same ride.
TrueFalse
3 printable pages
Page 1
Page 2
Page 3
About This Worksheet
Free in Kuraplan
Sign up free, grab the PDF, and customize it for your class.
Print-Ready
Formatted for standard paper. Clean layout, easy to read.
AI-Generated
Created with Kuraplan's AI, designed for real classroom use.
For Teachers & Parents
Use in classrooms, for homework, tutoring, or homeschool.
Need a custom version of this worksheet?
Kuraplan's AI generates custom worksheets in seconds — differentiated for every learner, aligned to your curriculum.
Generate Custom Worksheets — Free No credit card Curriculum-aligned Under 60 seconds