Tsunami Data Analysis Worksheet
A free science worksheet ready for your classroom. Open in Kuraplan to grab the print-ready PDF, customize it for your students, or generate a fresh version in seconds.
Tsunami Data Analysis Worksheet
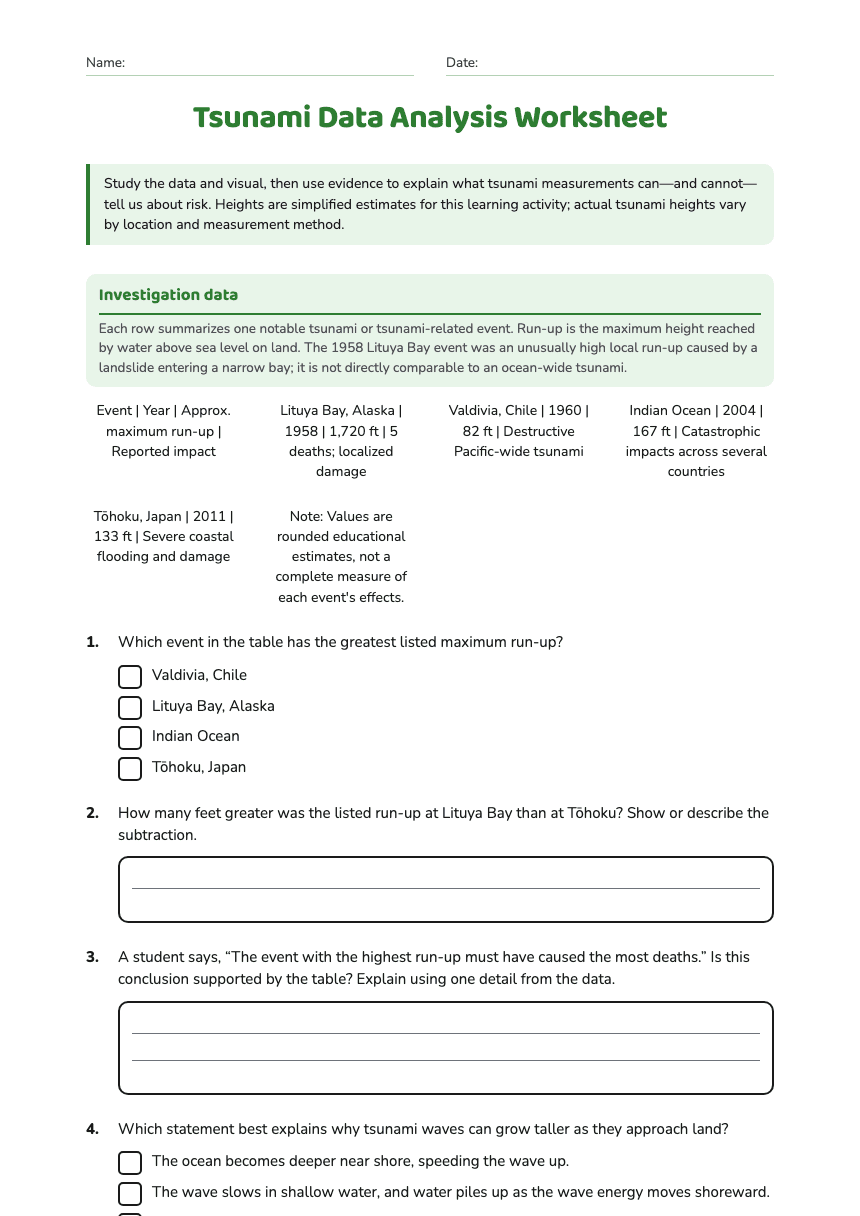
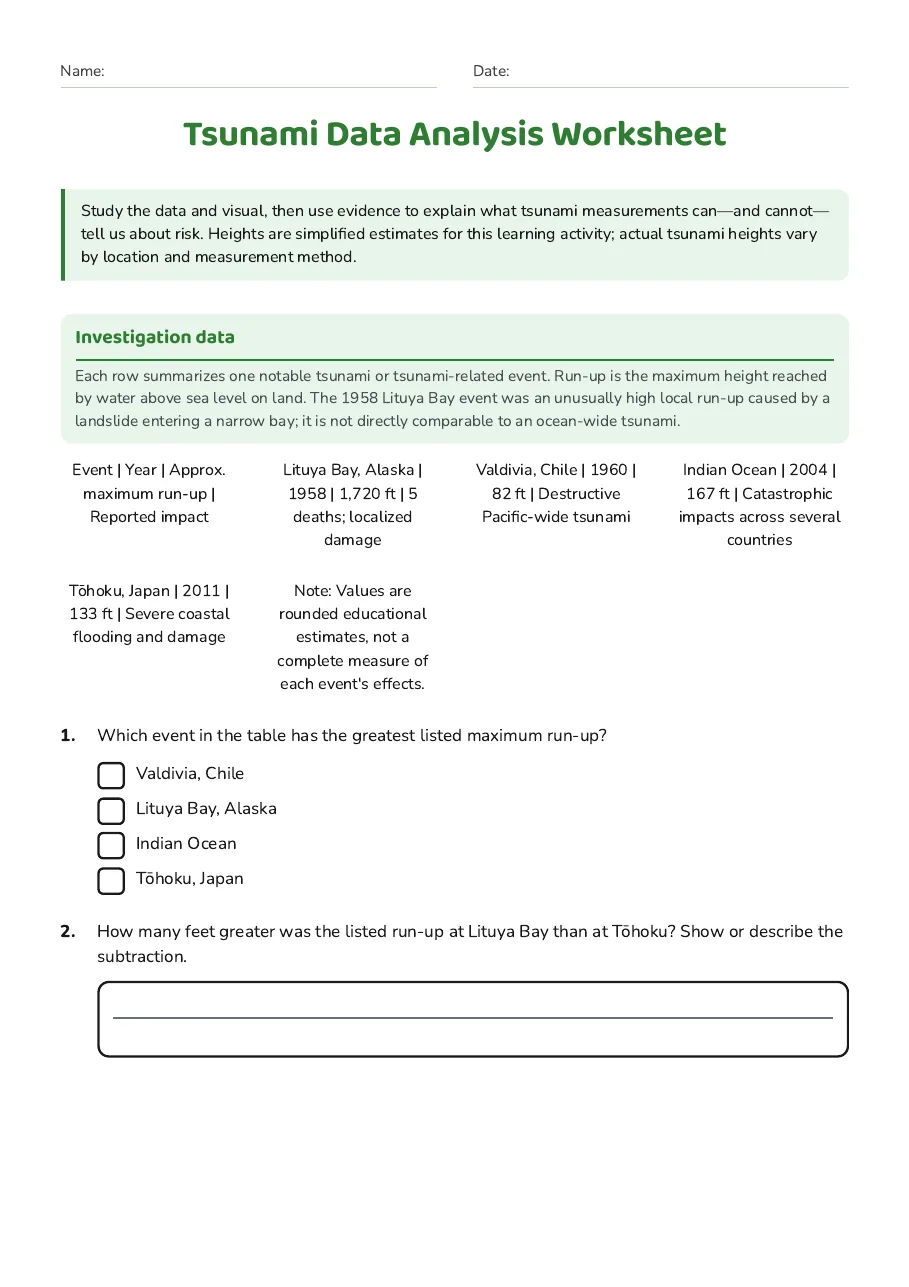
Investigation data
Each row summarizes one notable tsunami or tsunami-related event. Run-up is the maximum height reached by water above sea level on land. The 1958 Lituya Bay event was an unusually high local run-up caused by a landslide entering a narrow bay; it is not directly comparable to an ocean-wide tsunami.
Event | Year | Approx. maximum run-up | Reported impact
Lituya Bay, Alaska | 1958 | 1,720 ft | 5 deaths; localized damage
Valdivia, Chile | 1960 | 82 ft | Destructive Pacific-wide tsunami
Indian Ocean | 2004 | 167 ft | Catastrophic impacts across several countries
Tōhoku, Japan | 2011 | 133 ft | Severe coastal flooding and damage
Note: Values are rounded educational estimates, not a complete measure of each event's effects.
- Valdivia, Chile
- Lituya Bay, Alaska
- Indian Ocean
- Tōhoku, Japan
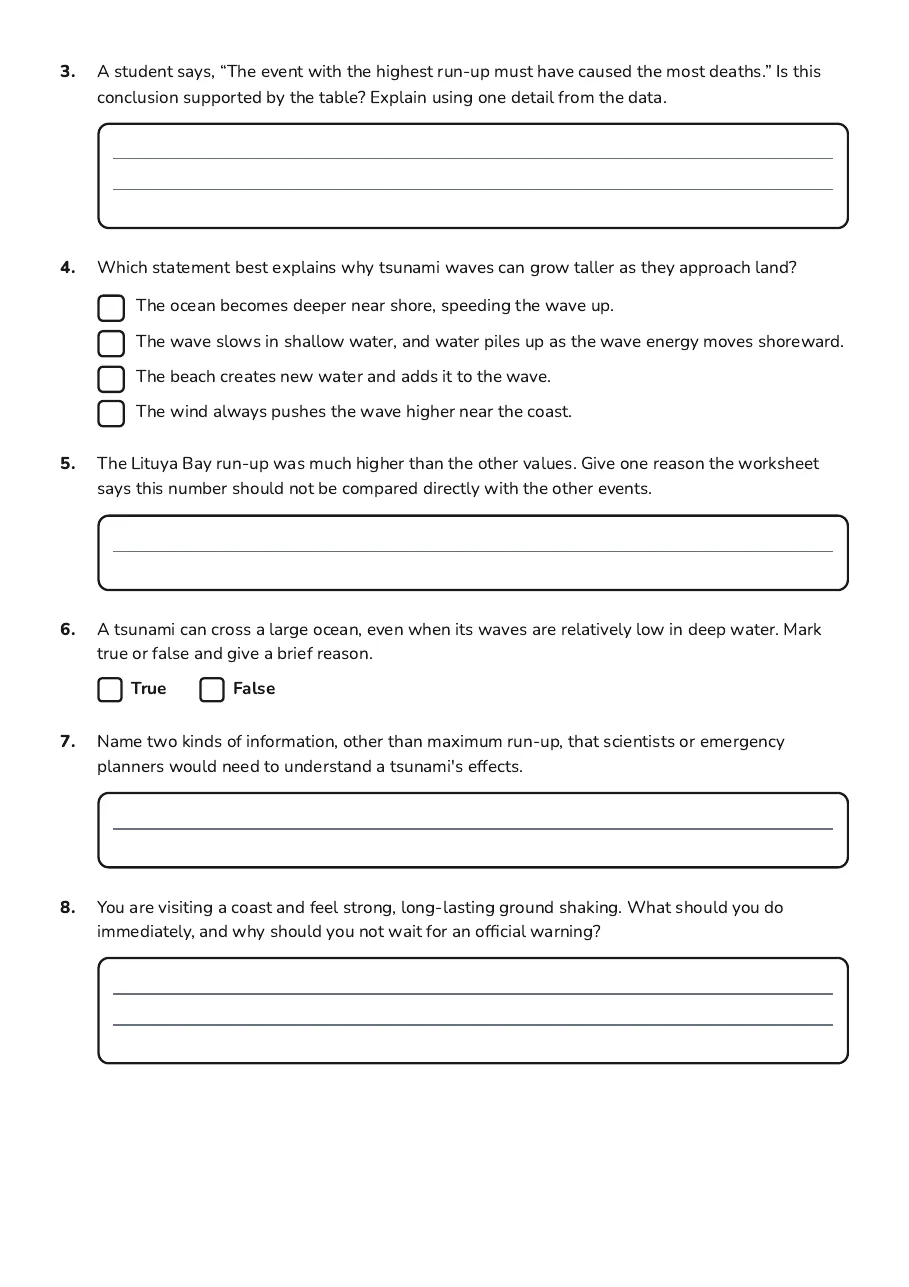
- The ocean becomes deeper near shore, speeding the wave up.
- The wave slows in shallow water, and water piles up as the wave energy moves shoreward.
- The beach creates new water and adds it to the wave.
- The wind always pushes the wave higher near the coast.
3 printable pages
Page 1
Page 2

Page 3
About This Worksheet
Free in Kuraplan
Sign up free, grab the PDF, and customize it for your class.
Print-Ready
Formatted for standard paper. Clean layout, easy to read.
AI-Generated
Created with Kuraplan's AI, designed for real classroom use.
For Teachers & Parents
Use in classrooms, for homework, tutoring, or homeschool.
Need a custom version of this worksheet?
Kuraplan's AI generates custom worksheets in seconds — differentiated for every learner, aligned to your curriculum.
Generate Custom Worksheets — Free