Linear Relationships Exploration
A free mathematics worksheet ready for your classroom. Open in Kuraplan to grab the print-ready PDF, customize it for your students, or generate a fresh version in seconds.
Linear Relationships Exploration

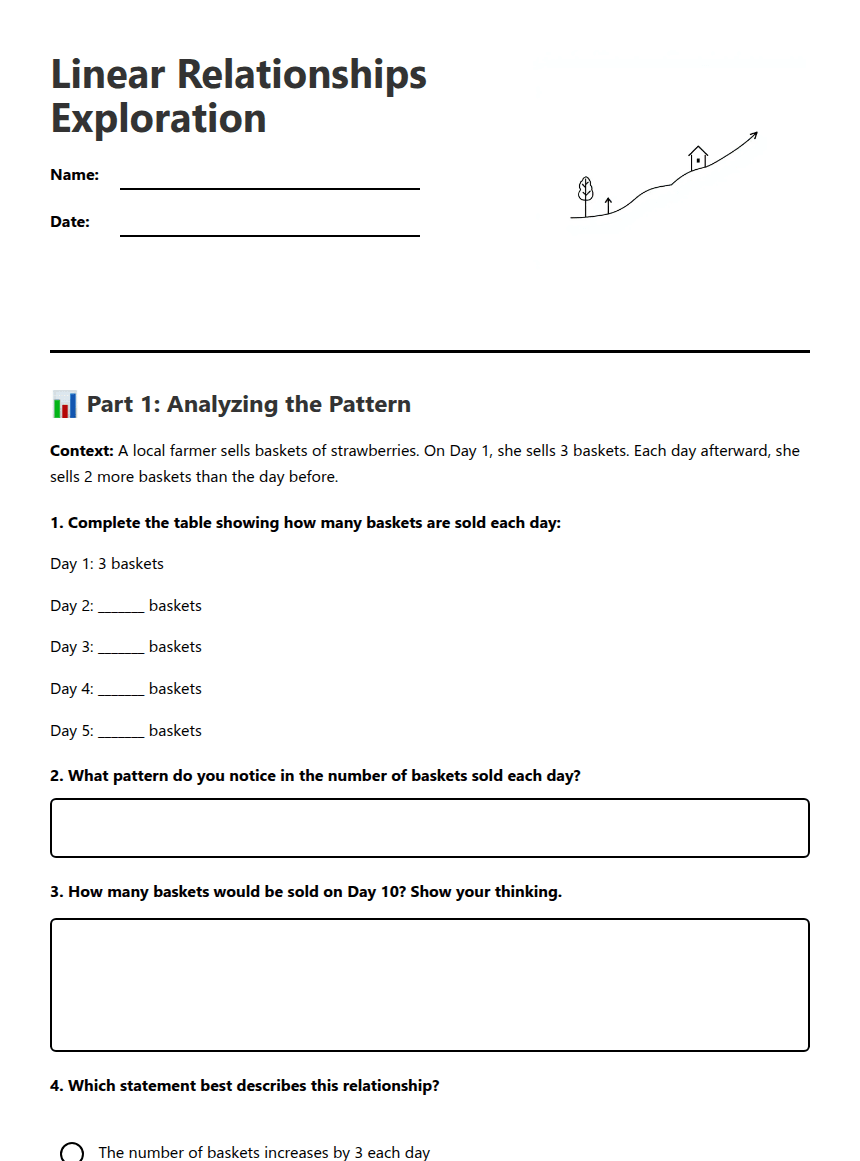
📊 Part 1: Analyzing the Pattern
Context: A local farmer sells baskets of strawberries. On Day 1, she sells 3 baskets. Each day afterward, she sells 2 more baskets than the day before.
Day 1: 3 baskets
Day 2: _______ baskets
Day 3: _______ baskets
Day 4: _______ baskets
Day 5: _______ baskets
📈 Part 2: Graphs and Equations
B = _________________________
🤔 Part 3: Extending Your Understanding
New equation: B = _________________________
About This Worksheet
Free in Kuraplan
Sign up free, grab the PDF, and customize it for your class.
Print-Ready
Formatted for standard paper. Clean layout, easy to read.
AI-Generated
Created with Kuraplan's AI, designed for real classroom use.
For Teachers & Parents
Use in classrooms, for homework, tutoring, or homeschool.
Need a custom version of this worksheet?
Kuraplan's AI generates custom worksheets in seconds — differentiated for every learner, aligned to your curriculum.
Generate Custom Worksheets — FreeMore Mathematics Worksheets
Proportional Relationships Practice
Free
Proportional Relationships Check
Free
Proportional Relationships Practice
Free
Ratio Basics Morning Work
Free
Unit Rate Shopping Challenge
Free
Ratio Practice Worksheet
Free
Real-World Ratios Worksheet
Free