Box Plot and Five-number Summary Mat
Free maths printable for teachers · Mats
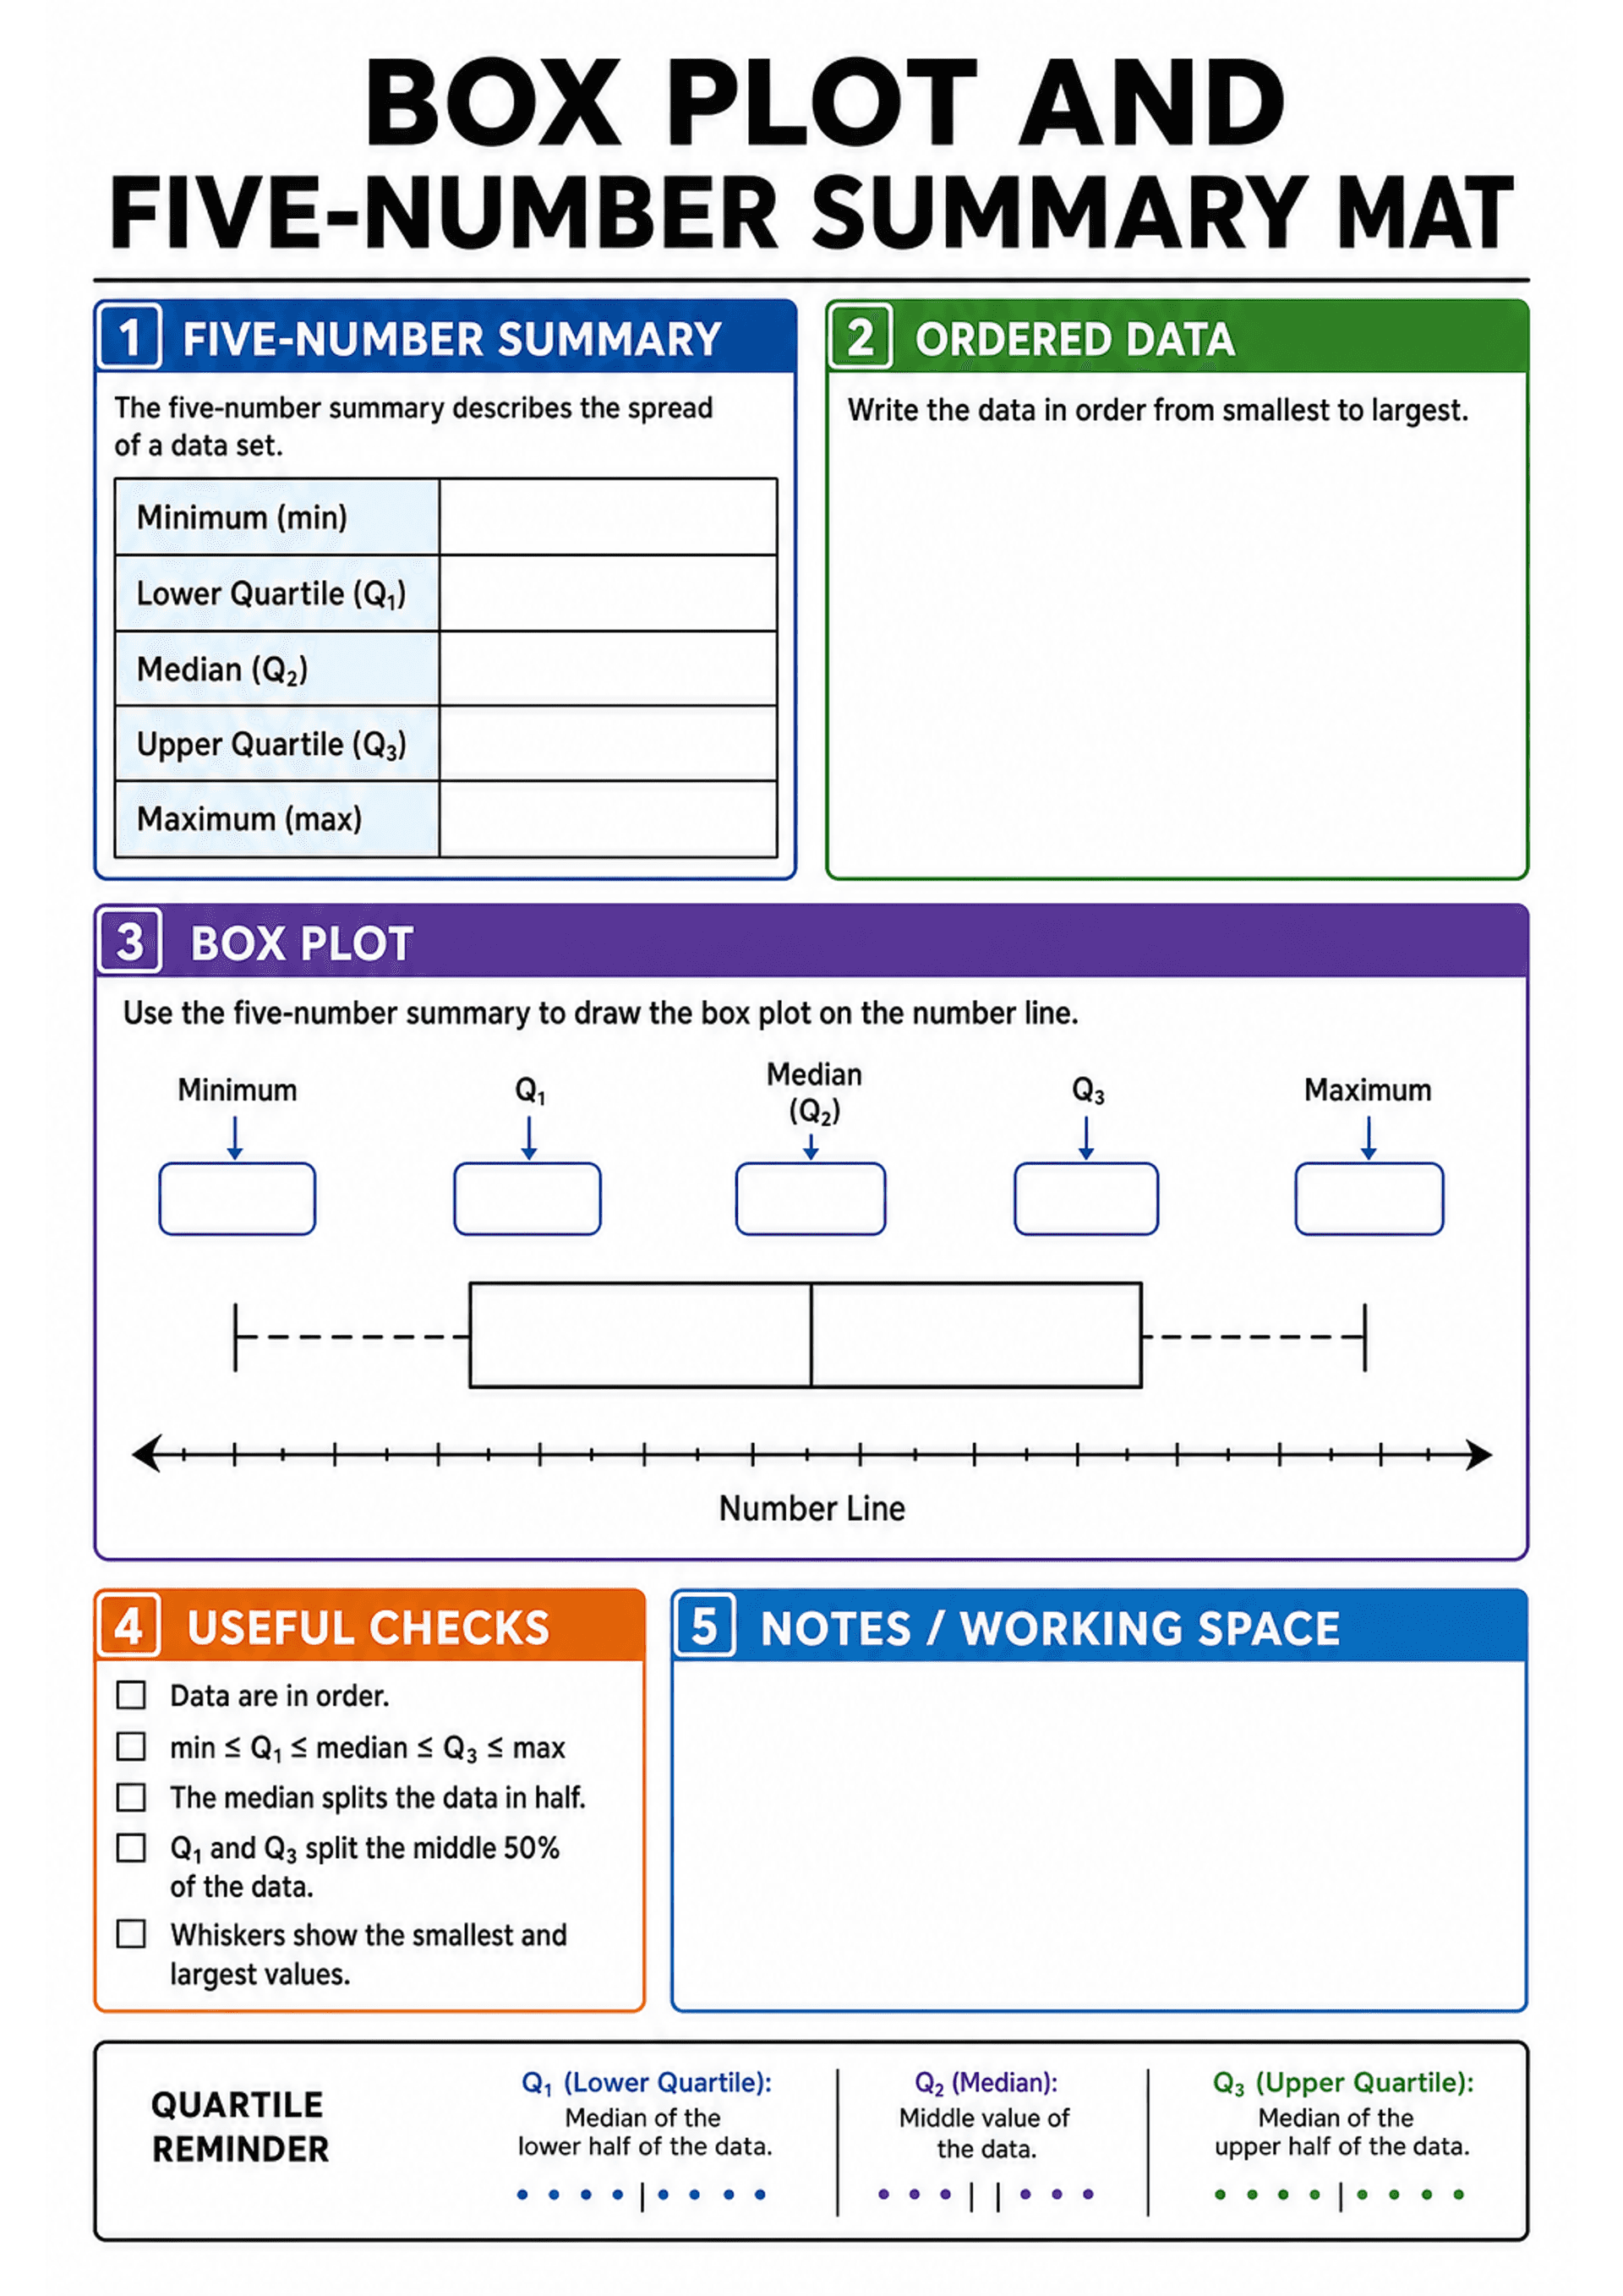
About this printable
This printable provides a structured template for students to record the minimum, Q1, median, Q3, and maximum values, order their data, and then construct a box plot on a provided number line. It includes quick checks and a notes area, along with reminders of quartile definitions. Use it as a scaffold when introducing box plots or as a reference sheet during practice to help students record their work and verify their understanding.
Make printables like this in seconds
Kuraplan generates maths worksheets, lesson plans and classroom resources matched to your curriculum.
Try Kuraplan free90-second quiz · no credit card
Related printables
More maths resources
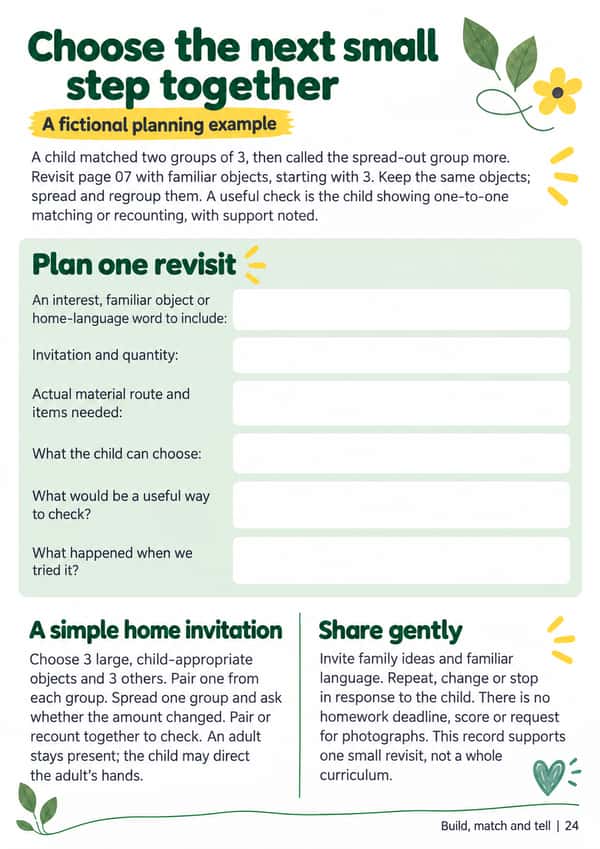
Adult guide: Choose the next small step together
Maths · Printable
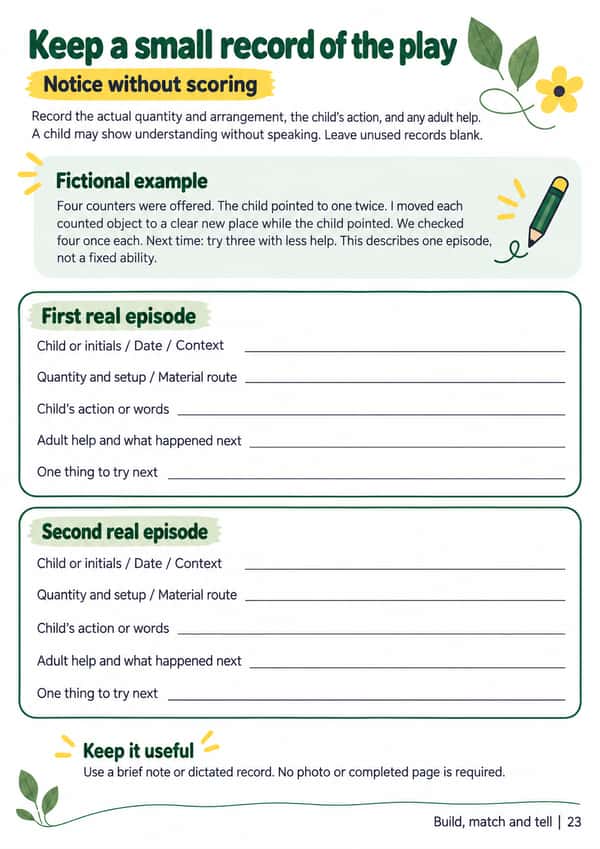
Adult guide: Keep a small record of the play
Maths · Printable
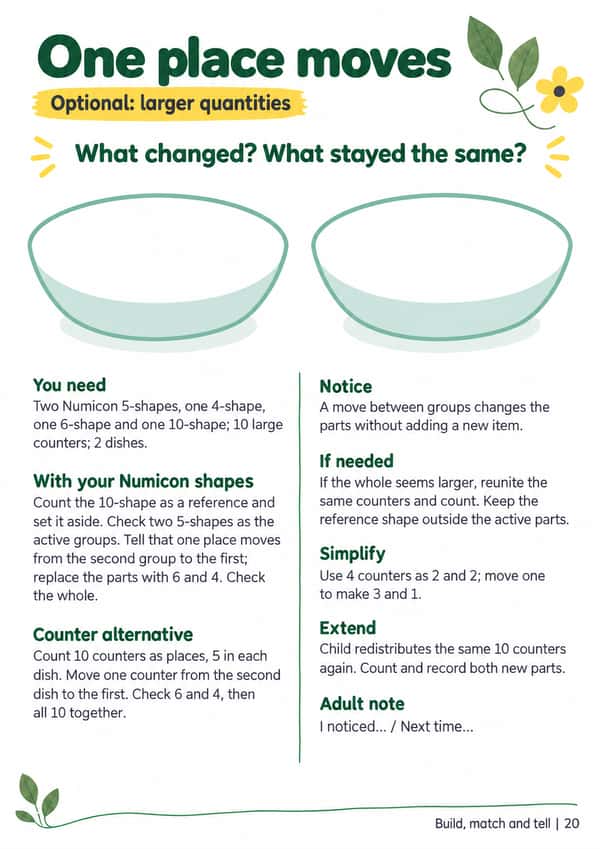
Adult guide: One place moves (optional larger quantities)
Maths · Printable
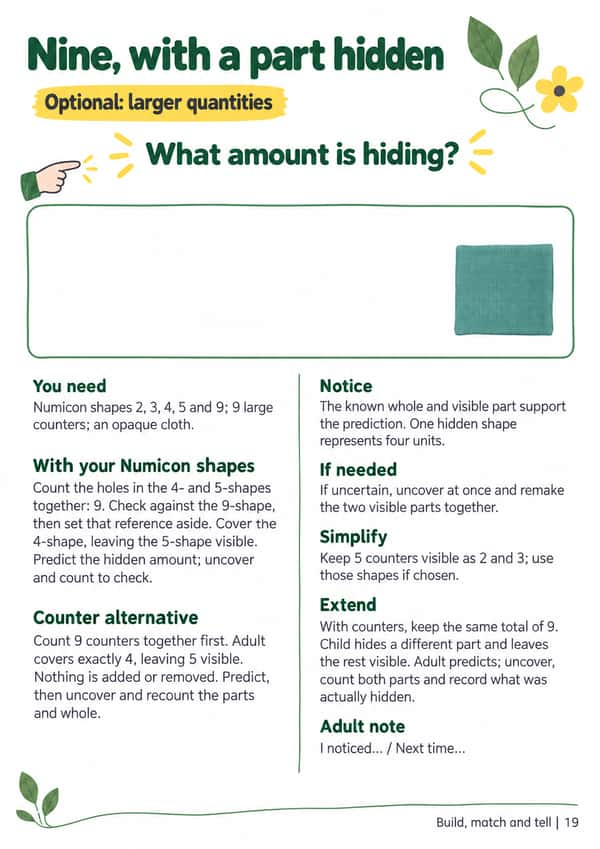
Adult guide: Nine, with a part hidden (optional larger quantities)
Maths · Printable
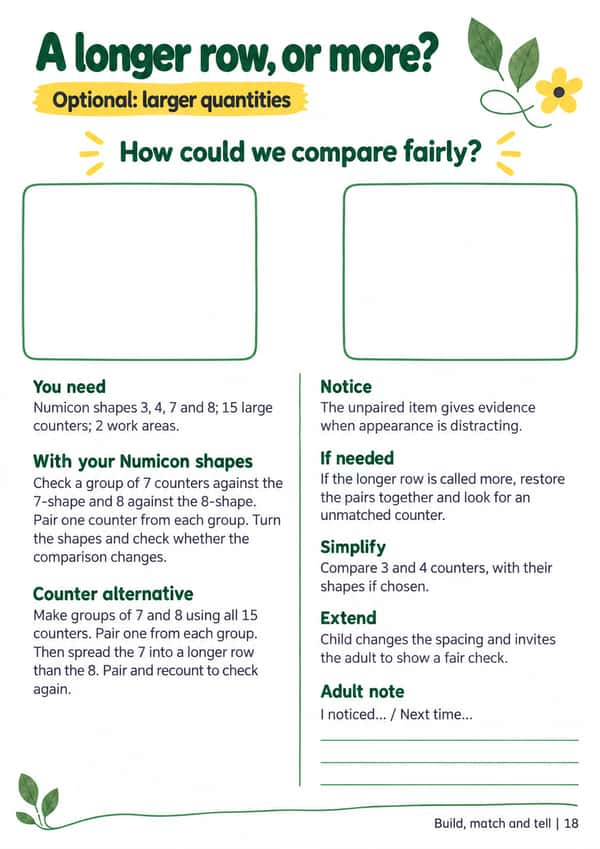
Adult guide: A longer row, or more? (optional larger quantities)
Maths · Printable
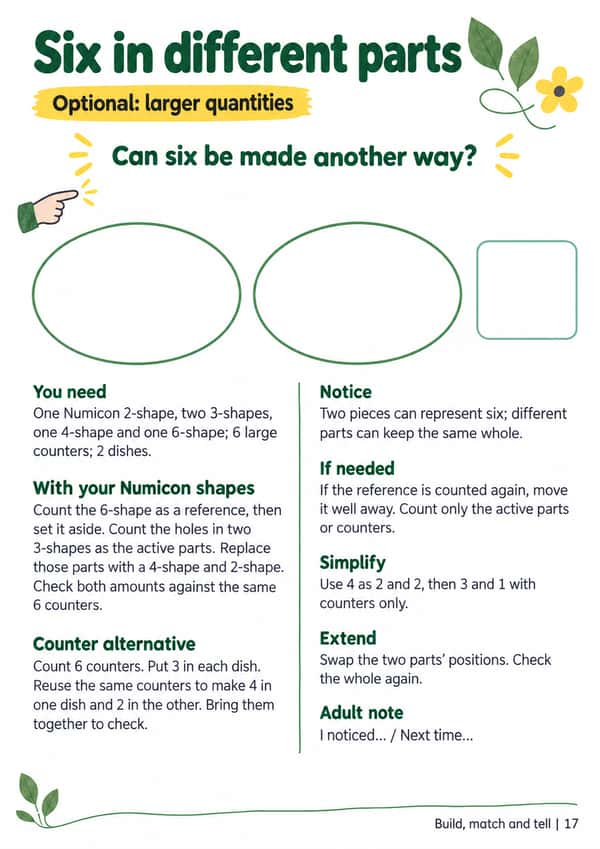
Adult guide: Six in different parts (optional larger quantities)
Maths · Printable
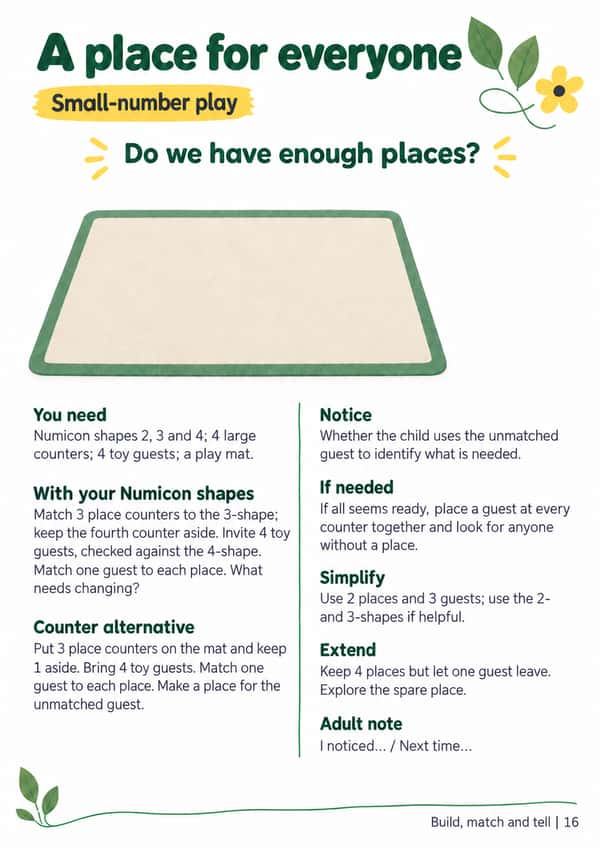
Adult guide: A place for everyone
Maths · Printable
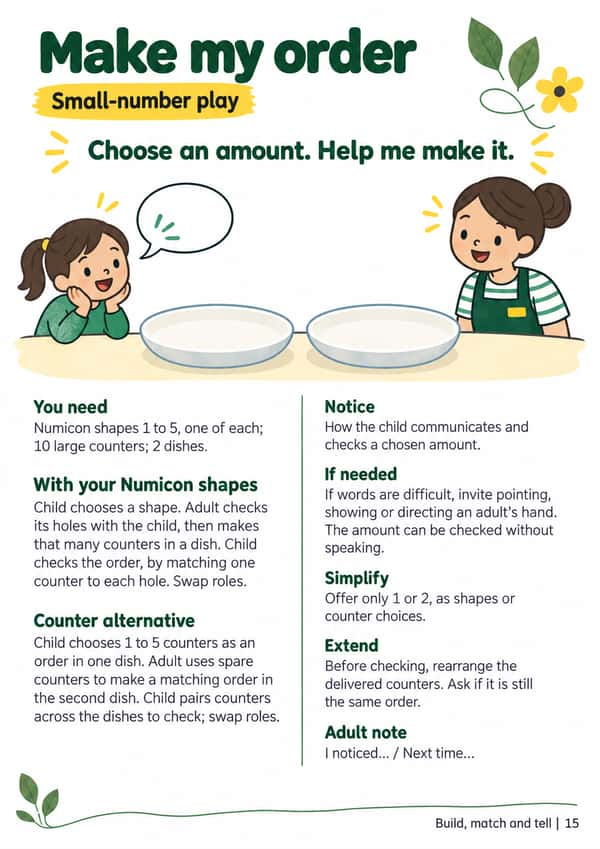
Adult guide: Make my order
Maths · Printable