Climate Graph Interpretation Mat
Free humanities & social sciences printable for teachers · Mats

About this printable
This printable provides a blank climate graph (dual y-axes for temperature °C and rainfall mm, months across the x-axis) plus a vertical ‘quick read’ panel and six scaffolded sections for description, interpretation, key terms and notes. It is designed to guide students through reading data from a climate graph, recording summary statistics (highest/lowest temperature, wettest/driest month, annual totals), and writing short evidence‑based conclusions about climate type, vegetation and human activities. The mat works either for students to plot supplied monthly data or to analyse a pre-drawn graph that you supply.
Make printables like this in seconds
Kuraplan generates humanities & social sciences worksheets, lesson plans and classroom resources matched to your curriculum.
Try Kuraplan free90-second quiz · no credit card
Related printables
More humanities & social sciences resources
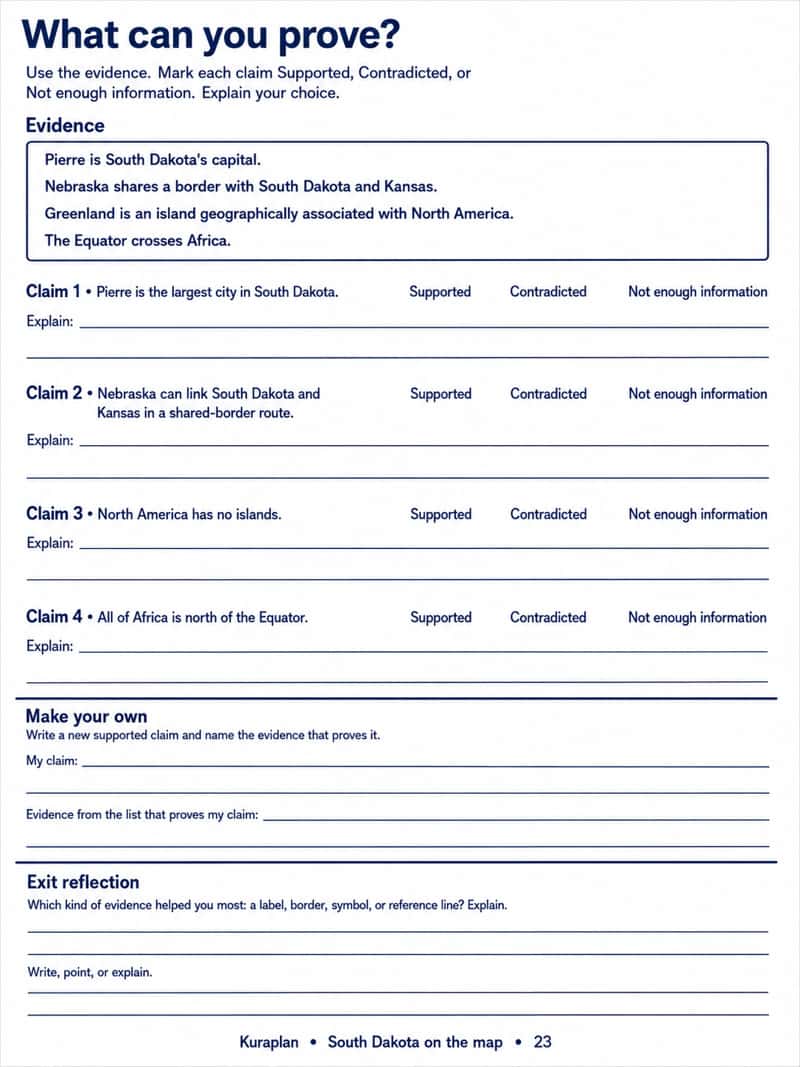
What can you prove?
Humanities & Social Sciences · Sheets & slips
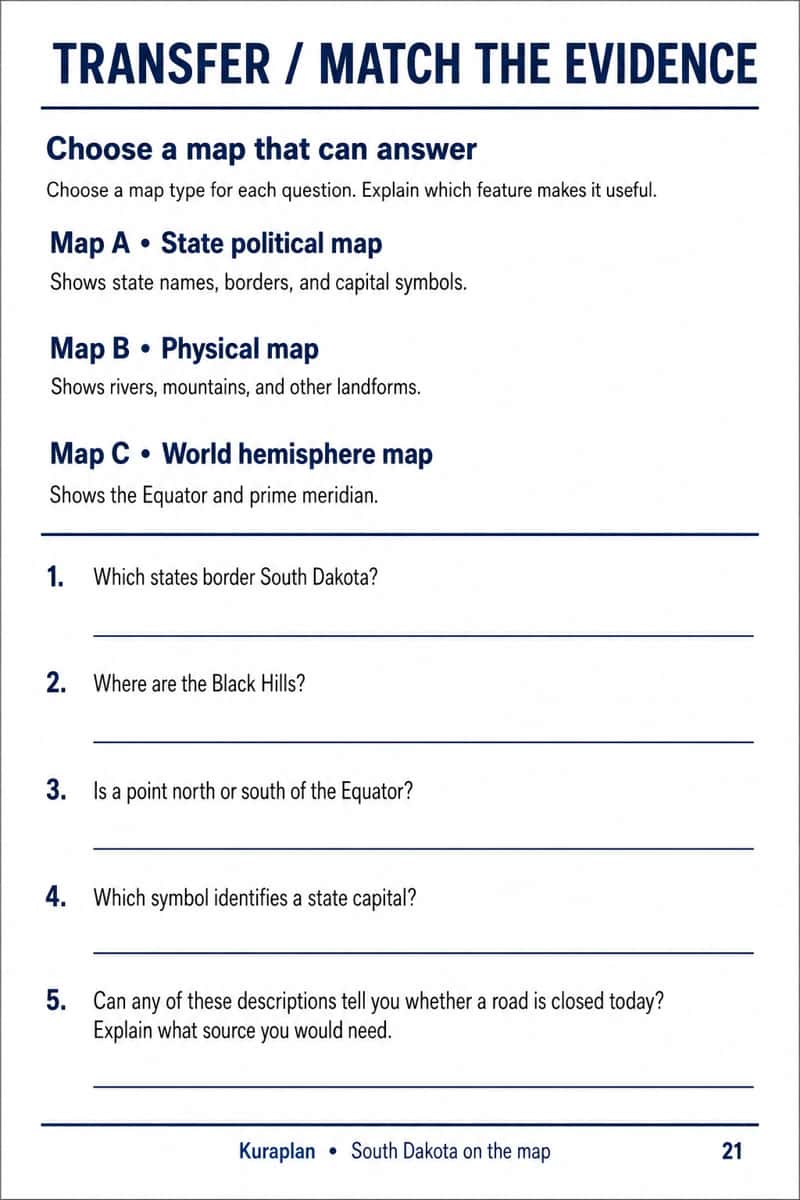
Choose a map that can answer
Humanities & Social Sciences · Sheets & slips
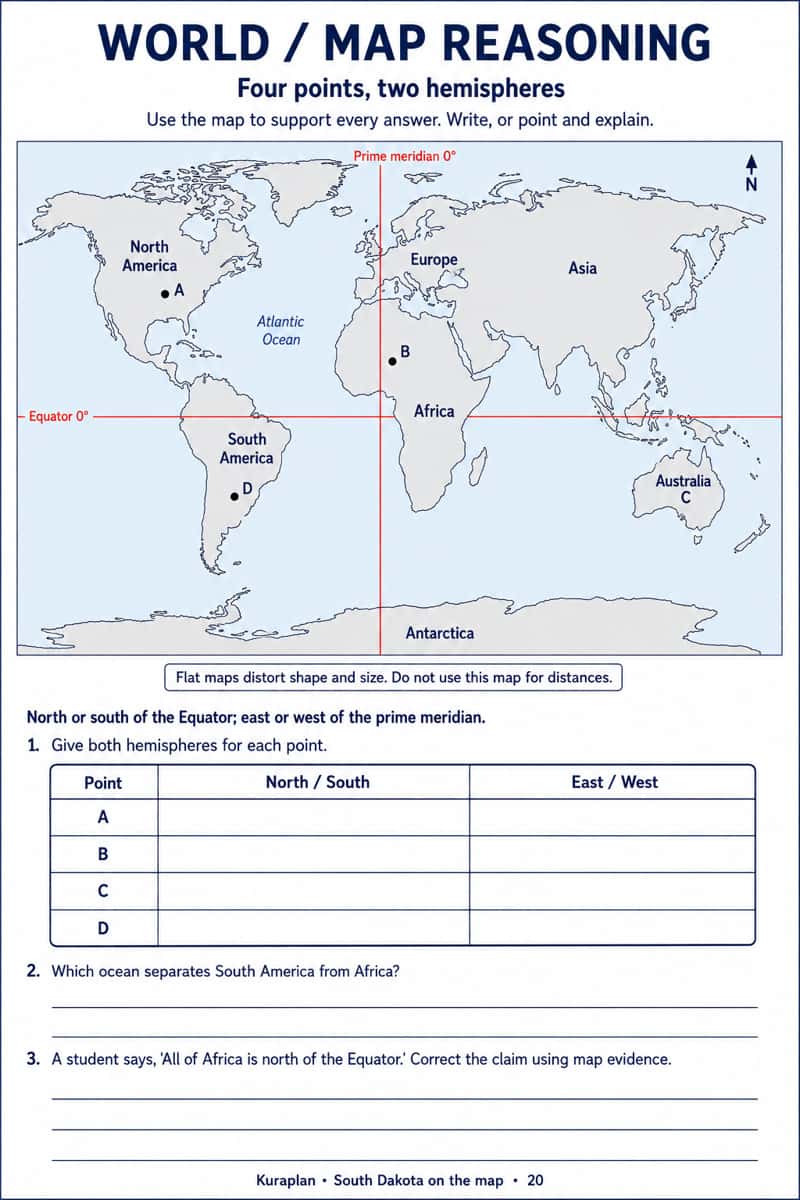
Four points, two hemispheres
Humanities & Social Sciences · Sheets & slips
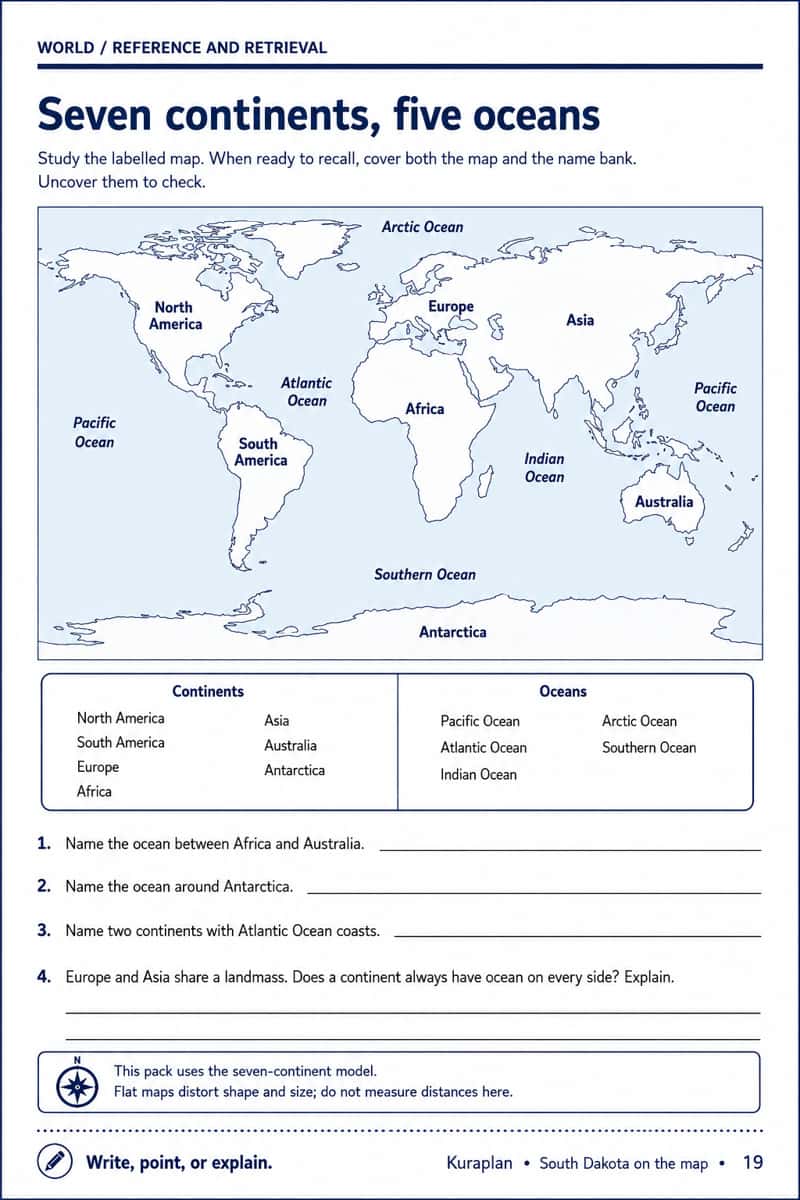
Seven continents, five oceans
Humanities & Social Sciences · Sheets & slips
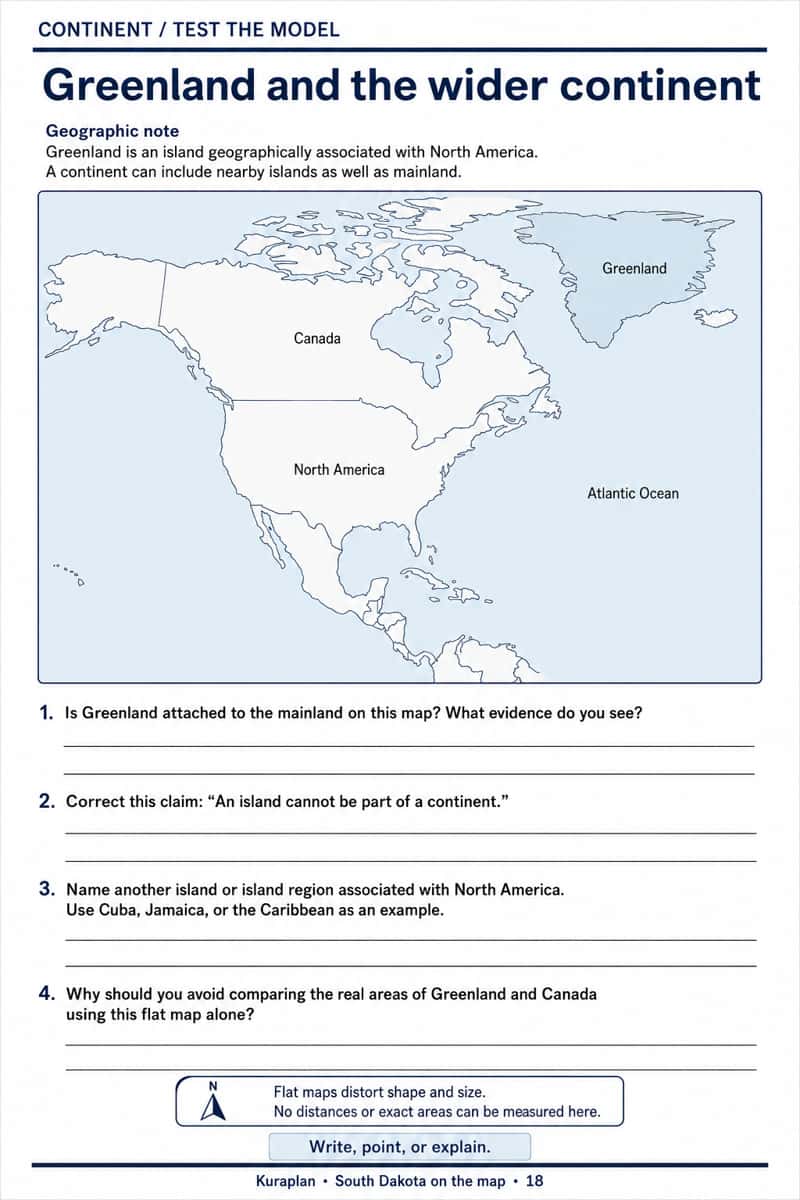
Greenland and the wider continent
Humanities & Social Sciences · Sheets & slips
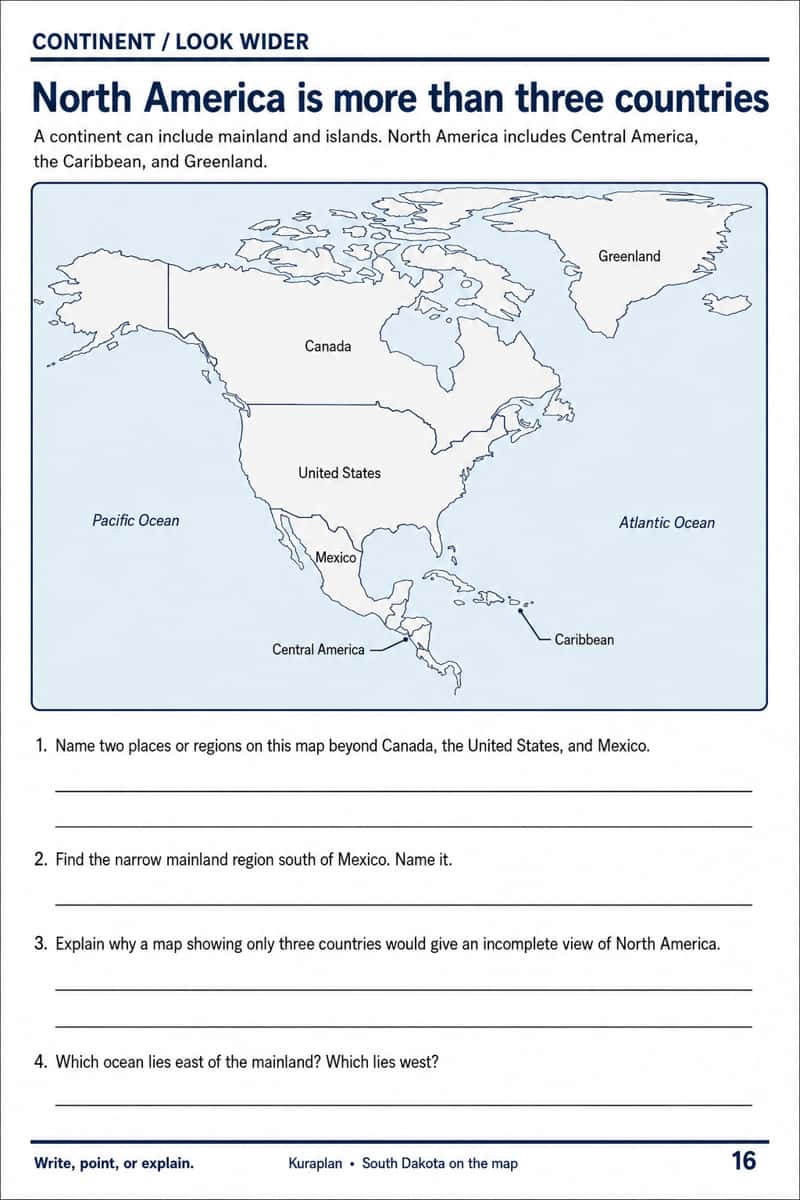
North America is more than three countries
Humanities & Social Sciences · Sheets & slips
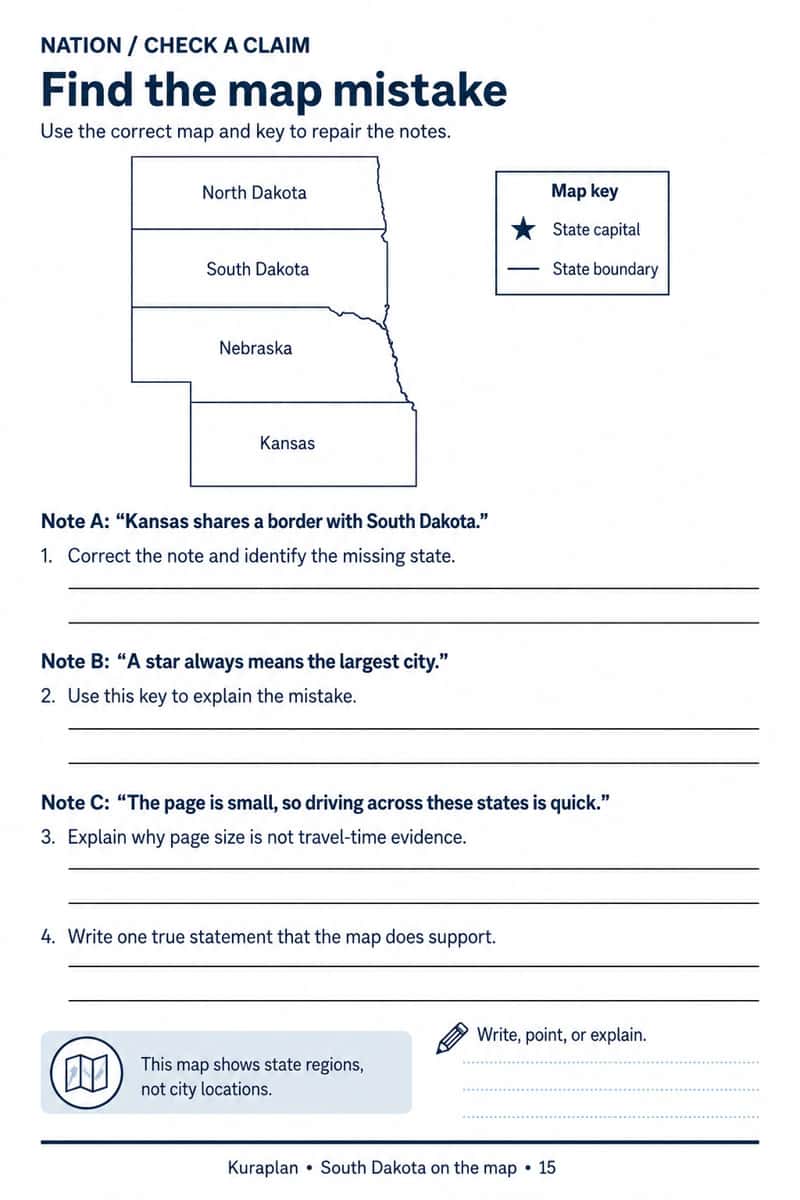
Find the map mistake
Humanities & Social Sciences · Sheets & slips
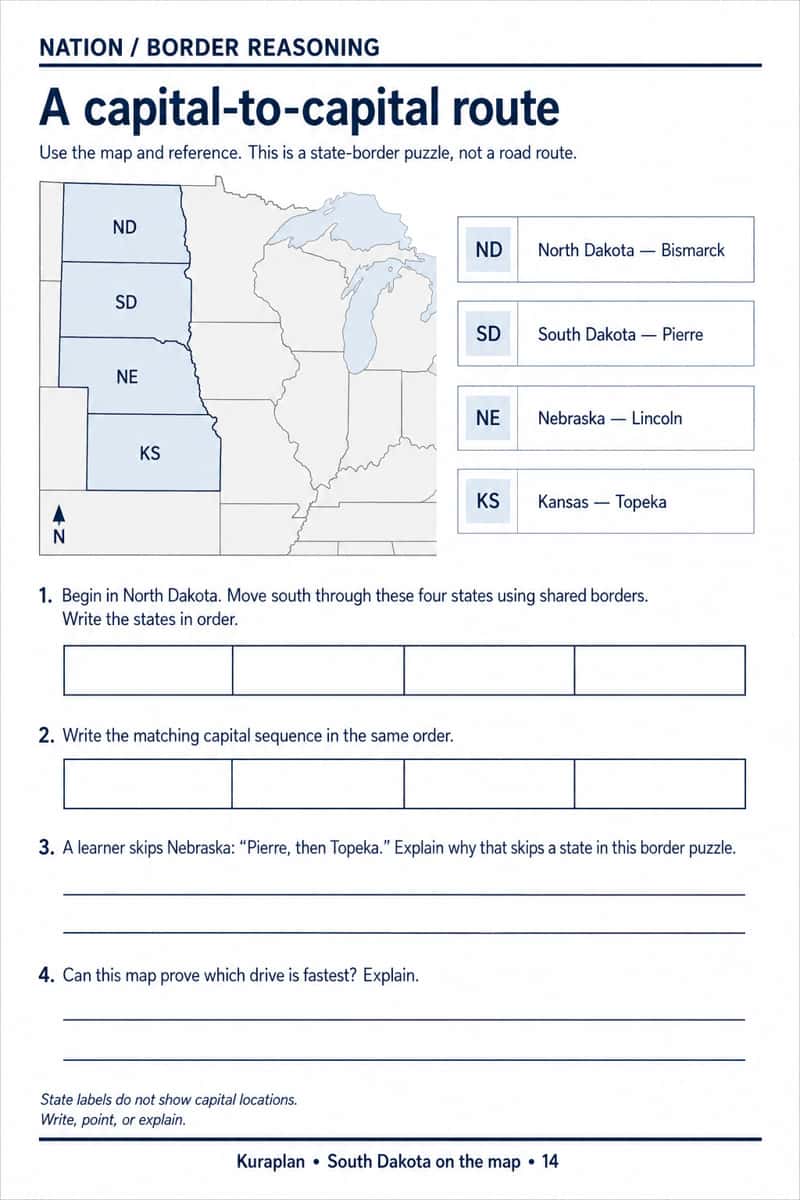
A capital-to-capital route
Humanities & Social Sciences · Sheets & slips